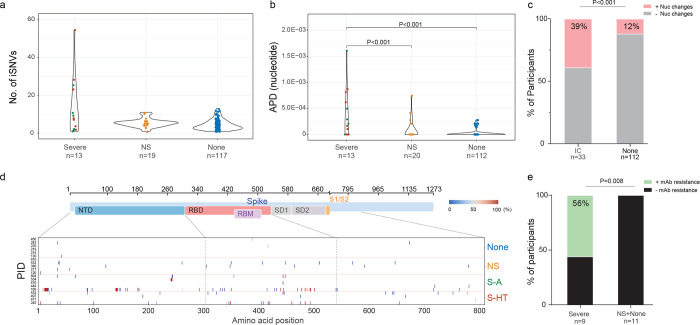
Figure 2. SARS-CoV-2 intra-host mutations among different immunocompromise groups.
a, Number of intra-host single-nucleotide variants (iSNVs) among severe (S-HT in red and S-A in green), non-severe immunocompromised and non-immunocompromised (None) groups. b, Nucleotide average pairwise distance (APD) among severe (S-HT in red and S-A in green), non-severe immunocompromised (NS) and non-immunocompromised (None) groups. c, Participants with any nucleotide changes during follow-up. d, Heat map showing distribution of Spike polymorphisms from participants receiving mAb treatment. Each row represents one participant, while x axis shows amino acid positions in the Spike gene. Different domains of Spike are shown at the top. Colors indicate frequency of polymorphisms, with blue indicating the lowest value and red indicating the highest value in the scale. Participants in different study groups are separated by a red horizontal line. e, Proportion of mAb resistance emergence amongst those treated with mAbs, categorized by those with severe or non-severe/no immunosuppression. Comparison of iSNV and APD between groups were done using using Dunn’s test with Benjamini-Hochberg P value adjustment. Fisher’s exact test was used to calculate significance between participants with and without viral evolution and further, in participants with and without mAb treatment specific resistance mutations. Only significant P values are shown. NTD, N-terminal domain; RBD, receptor binding domain; RBM, receptor binding motif; S1, subunit 1; S2, subunit 2.

