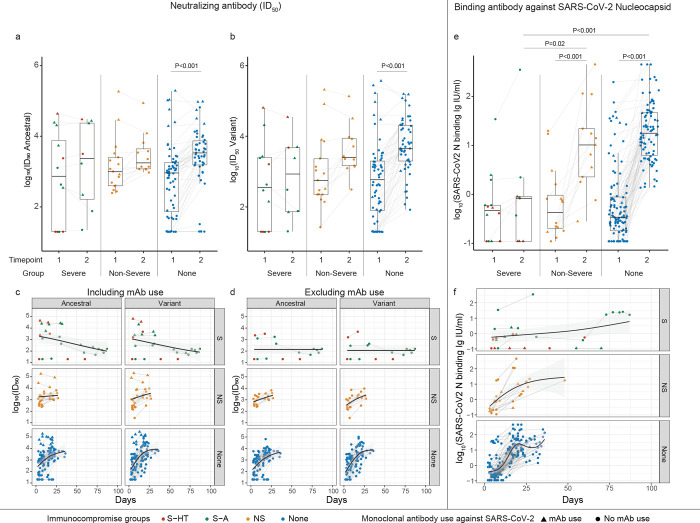
Figure 3. Neutralizing antibody (nAb) and Nucleocapsid binding antibody levels among different immunocompromised groups.
a, nAb levels (50% inhibitory dilution [ID50]) against ancestral Spike protein. b, nAb levels against variant-specific Spike protein. c and d, Longitudinal trajectory of nAb in different immunocompromise groups, including (c) or excluding (d) monoclonal antibody use. e, binding antibody levels against Nucleocapsid protein. f, Longitudinal trajectory of binding antibody in different immunocompromise groups. Comparison between different immunocompromise groups at the same time point was performed using Dunn’s test with Benjamini-Hochberg P value adjustment. Comparison of longitudinal antibody changes for participants with two blood draws was performed using the pairwise Wilcoxon rank sum test with Benjamini-Hochberg P value adjustment. Only significant P values were shown. Tukey boxplot was used to summarize antibody levels. Generalized additive model was used to evaluate the trend of antibody development with 95% confidence intervals in the shaded area. Lines between two timepoints indicate the same participants with two blood draws. S-HT, severe hematologic-oncology/transplant; S-A, severe autoimmune/B-cell deficient; NS, non-severe. Severe group included both S-HT and S-A as they had comparable antibody levels at multiple time points.

