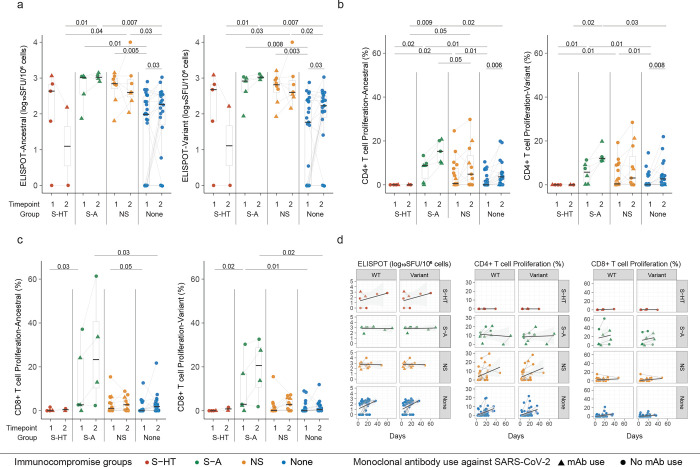
Figure 4. Spike-specific T levels among different immunocompromised groups.
a, enzyme-linked immunosorbent spot (ELIspot) assays using peptide pools derived from ancestral and variant-specific Spike protein. b, c, CD4+ T cell (b) and CD8+ T cell proliferation (c) upon stimulation of ancestral- and variant-specific Spike peptide pools. d, Longitudinal trajectory of Spike-specific T levels in different immunocompromise groups. Comparison between different immunocompromise groups at the same time point was performed using Dunn’s test with Benjamini-Hochberg P value adjustment. Comparison of longitudinal antibody changes for participants with two blood draws was performed using the pairwise Wilcoxon rank sum test with Benjamini-Hochberg P value adjustment. Only significant P values were shown. Tukey boxplot was used to summarize antibody levels. Generalized additive model was used to evaluate the trend of antibody development with 95% confidence intervals in the shade area. Lines between two timepoints indicate the same participants with two blood draws.

