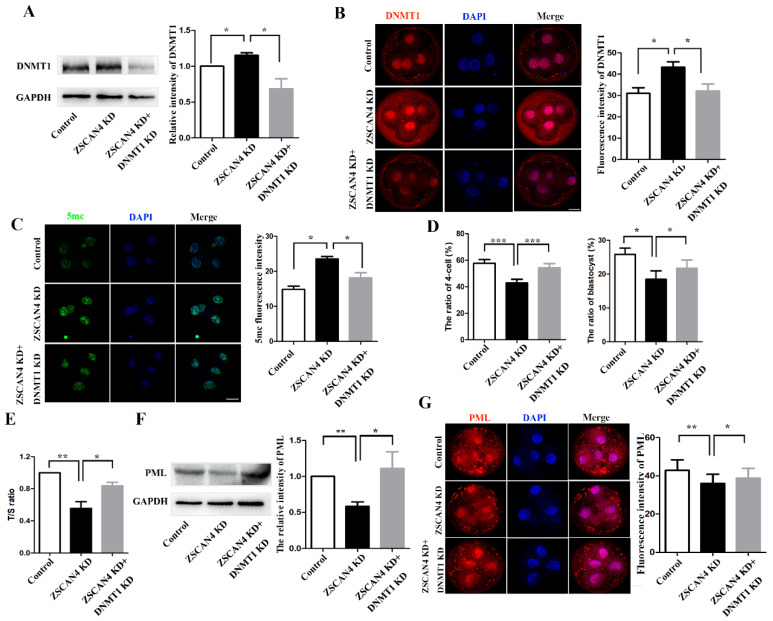
Figure 5.
ZSCAN4 regulated DNMT1 expression to stabilize telomere length. (A) Band intensity analysis of DNMT1 in the four-cell stage after ZSCAN4 KD and DNMT1 KD. (B) Images and fluorescence intensity of DNMT1 in control embryo (n = 130), ZSCAN4 KD embryos (n = 133), and ZSCAN4 KD + DNMT1 KD embryos (n = 129). Red: DNMT1; blue: DNA. Bar = 20 μm. (C) Images and fluorescence intensity of 5mc in control embryo (n = 75), ZSCAN4 KD embryos (n = 84), and ZSCAN4 KD + DNMT1 KD embryos (n = 61). Green: 5mc; blue: DNA. Bar = 20 μm. (D) Four-cell and blastocyst ratio after ZSCAN4 KD and DNMT1 KD. (E) qPCR assay for relative telomere length in the four-cell stage. Pig 36B4 single copy gene was used as the control gene. (F) Band intensity of PML in the four-cell stage after ZSCAN4 KD and DNMT1 KD. (G) Images and fluorescence intensity of PML in the control group (n = 138), ZSCAN4 KD group (n = 104), and ZSCAN4 KD + DNMT1 KD group (n = 104). Red: PML; blue: DNA. Bar = 20 μm. Results with * p < 0.05, ** p < 0.01 and *** p < 0.001 were considered significant.

