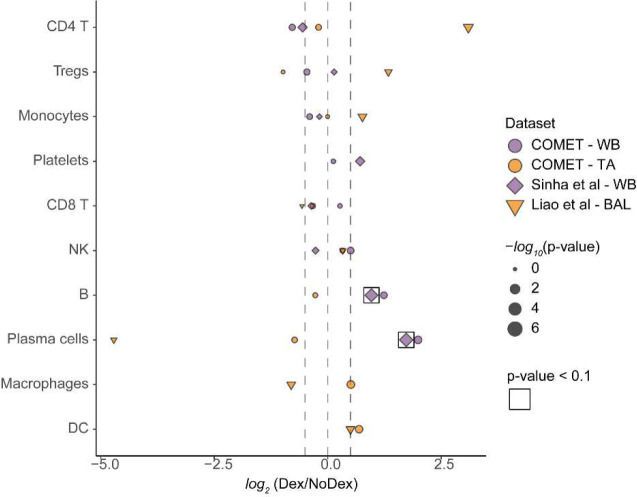
Extended Data Figure 5 |. Immune cell frequencies quantified and compared between Dex and NoDex samples.
X-axis shows log2 fold-difference of Dex compared to NoDex in whole blood (purple circle); TA (orange circle); a blood validation set (Sinha et al, purple diamond); a lung validation set (bronchial alveolar lavage; Liao et al, orange triangle). Significance shown by boxes. The size of each shape corresponds to −log10 p-value calculated using the Wilcoxon test.

