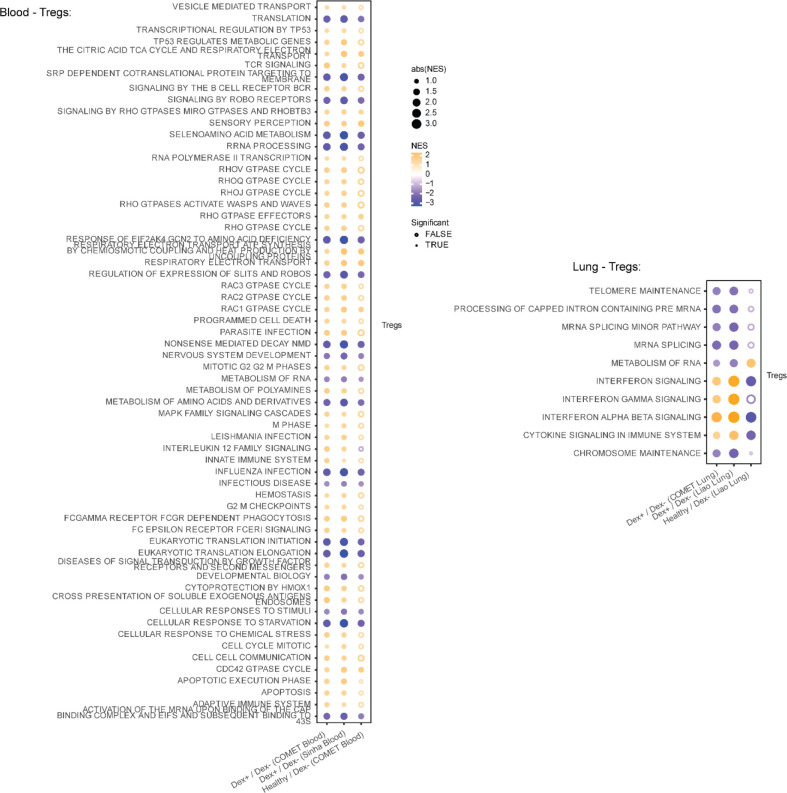
Extended Data Figure 6 |. Gene set enrichment of Tregs in blood and lung.
Net enrichment scores from gene set enrichment analysis in blood and lung shown for Tregs (remaining cell types shown in Figure 4). Fold differences are shown for dexamethasone-treated samples (Dex), or healthy control samples, all relative to the NoDex samples within that dataset. Orange shows up in Dex or healthy relative to NoDex COVID-19 samples, bule shows down in Dex or healthy. Datasets represented are from COMET (whole blood, TA), Sinha et al (blood) and Liao et al (BAL).

