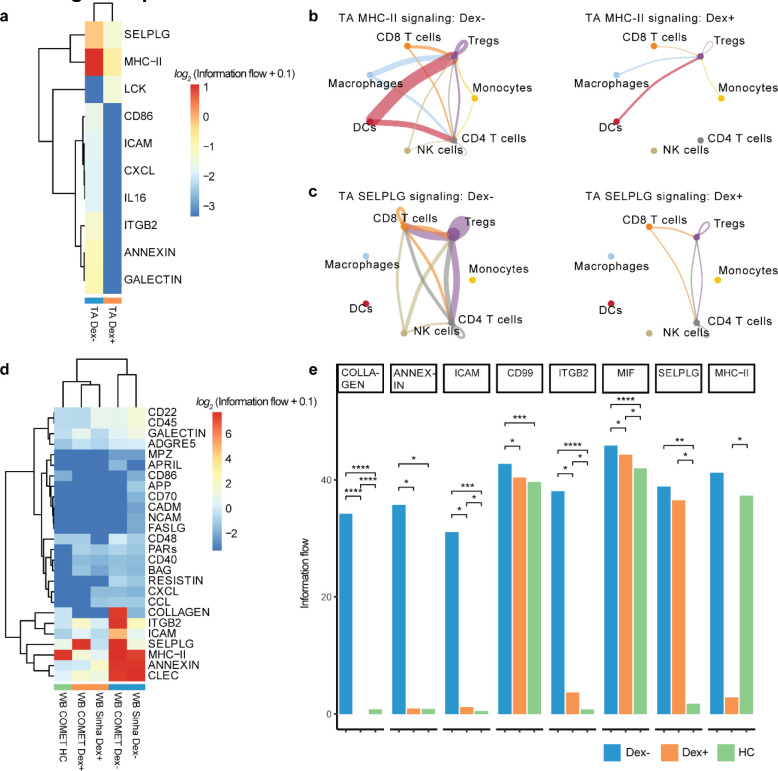
Figure 5: Receptor ligand inference from single-cell sequencing data reveals decrease in inflammation, antigen presentation, and T cell recruitment in blood and lung in response to dexamethasone.
a, Clustered heatmap of CellChat results of TA samples from Dex as compared to NoDex patients with significant receptor-ligand pairs shown (p-value < 0.05 and |log2 fold-difference| > 1). b,c, Cell type interaction networks for MHC-II (b) and SELPLG interactions (c) shown comparing NoDex (left) and Dex (right) patients of TA samples. Line thickness represents predicted strength of the interaction. d, Clustered heatmap of CellChat results of blood samples from Dex (COMET), Dex (Sinha et al), NoDex (COMET), NoDex (Sinha et al), and healthy controls (COMET) with receptor-ligand pairs that are significant between at least one pair of patient groups are shown (p-value < 0.05 and | log2 fold-difference| > 1). e, Comparisons for the COMET dataset shown between Dex, NoDex, and healthy controls for a subset of significantly detected receptor-ligand interactions (*adj. p<0.1, **adj. p<0.001, ***adj. p<0.0001, ****adj. p<0.00001).

