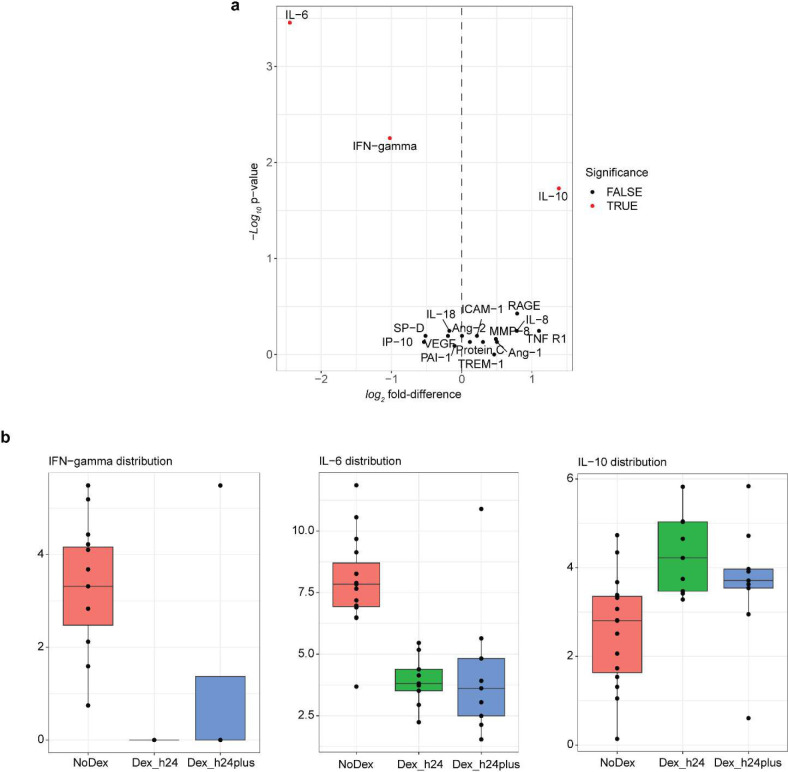
Extended Data Figure 2 |. Differences in cytokine expression.
a, Volcano plot of cytokines comparing Dex (right > 0) and NoDex (left < 0), colored by significance (red; Wilcoxon test, adjusted p-value < 0.1). N = 23 Dex, N = 15 NoDex, for 18 cytokines; day 0 of hospitalization. b, Cytokine differences, stratified by time between first dexamethasone dose and sample collection.

