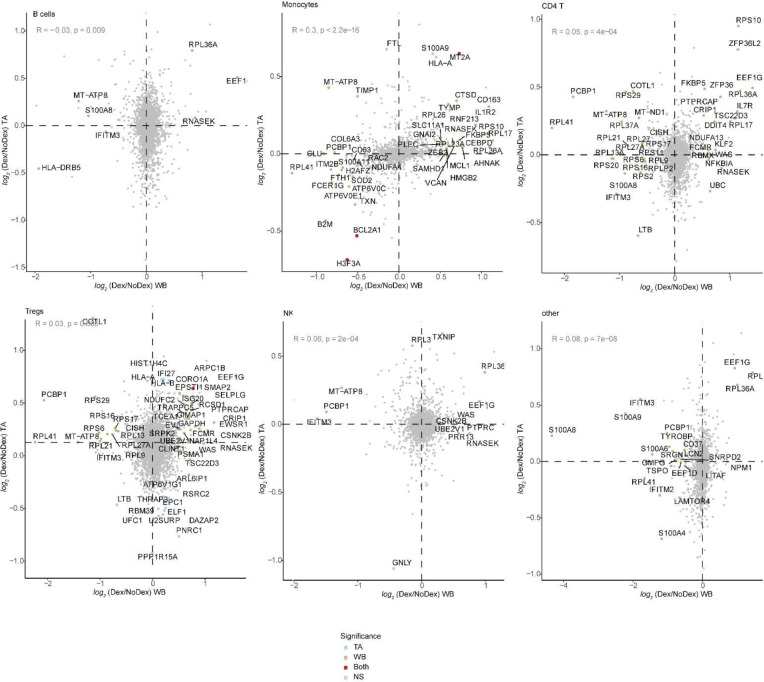
Extended Data Figure 4 |. Cross tissue differential gene expression.
log2 fold-difference in gene expression of Dex and NoDex in TA (y-axis) v. blood (x-axis) plotted for additional cell types not shown in Figure 3. Significant genes in TA only (blue), blood only (brown), both compartments (red) are shown (adj. p-value < 0.1 & | log2 fold-difference| > 0.5). Spearman’s correlation R value shown between the two compartments.

