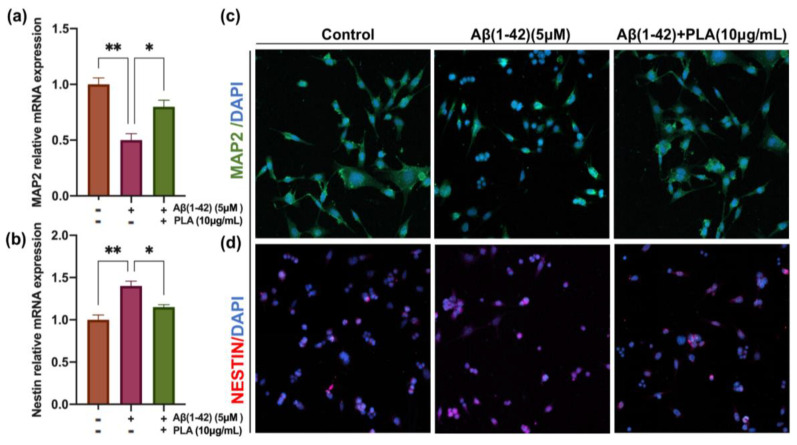
Figure 2.
The effect of PLA (10 μg/mL) on differentiation capacity of Aβ (1-42) (5 μM)-treated NSCs (a,b) The mRNA levels of MAP2 and Nestin in NSCs after 7 days differentiation. (c) MAP2 immunofluorescence staining. (d) NESTIN immunofluorescence staining. Data was analyzed by one-way ANOVA with Tukey’s post hoc test and are shown as mean ± SEM (n = 3). * p < 0.05, ** p < 0.01.

