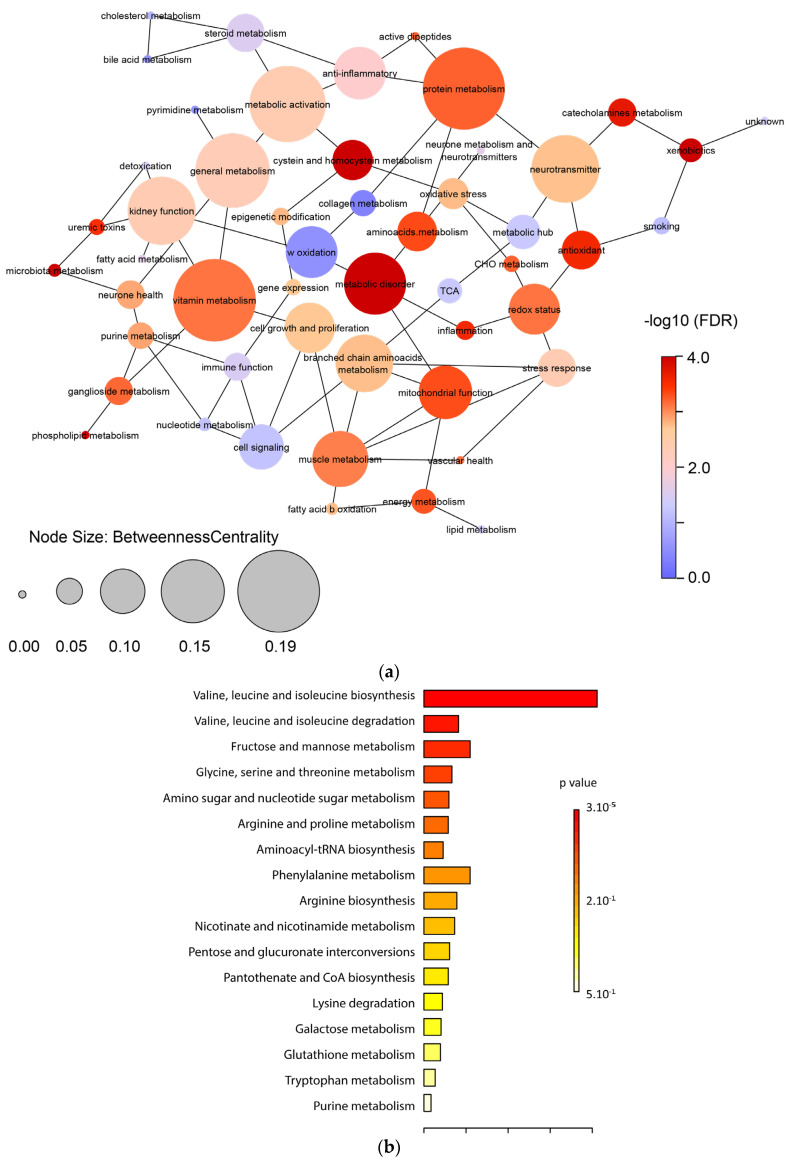
Figure 4.
(a) Partial correlation network integrating all the metabolic functions, displaying interactions and betweenness centrality. The node color corresponds to the statistical significance between the DR and Control groups. The node size relates to the value of the betweenness centrality coefficients calculated in Cytoscape. Initial partial correlations were defined as p ≤ 0.25. A node with higher betweenness centrality has more weight in the network. Thus, in addition to the statistical significance, this element of network topology permits an appreciation of the importance of specific metabolic regulations in biological systems. (b) KEGG enrichment analysis of the central node “metabolic disorder”.

