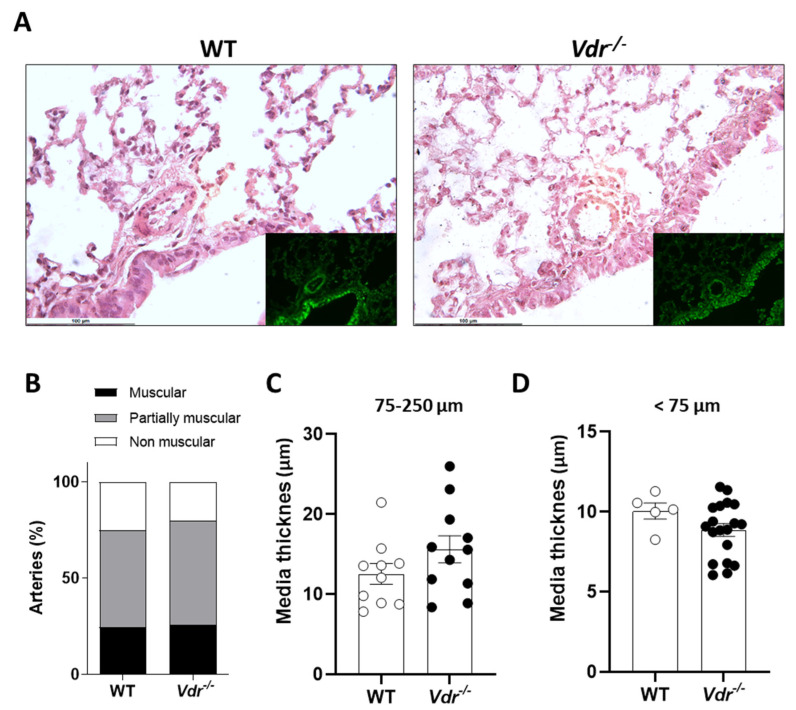
Figure 3.
Lung histology. (A) Representative lung section images stained with hematoxylin and eosin and examined by light microscopy; the insets show elastin visualized by its green autofluorescence. (B) Percentage of muscular (black), partially muscular (grey), and non-muscular (white) vessels (n = 4 mice per group, 1–5 vessels analyzed per mouse). (C,D) PA medial wall thickness of 75–250 µm and <75 µm, respectively.

