
Table 1.
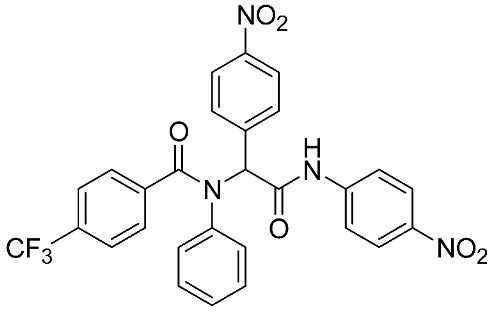
The chemical structures of synthetic MMP-9 inhibitors with their IC50/EC50 values. All chemical structures were produced using ChemDraw version 7.
| Inhibitor | Cell Line | IC50/EC50 | Chemical Structure |
|---|---|---|---|
| Compound 1 [79] | 4T1 cells | EC50 = 139 µM |
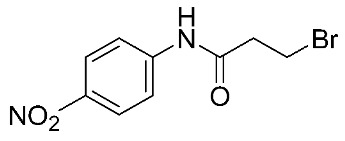
|
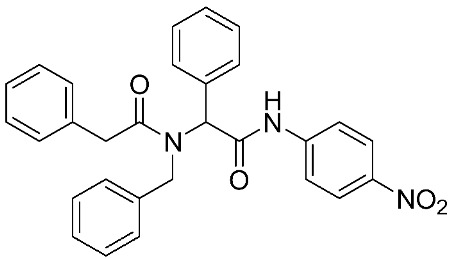
| Compound 2 [79] | 4T1 cells | EC50 = 125 µM |
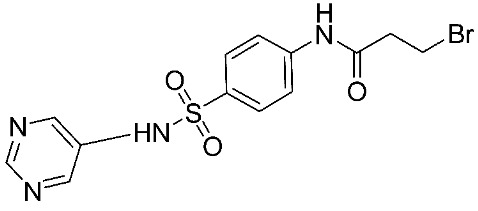
|
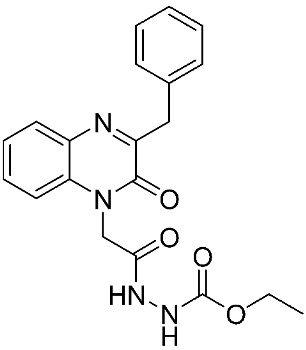
| Compound 3 [79] | 4T1 cells | EC50 = 132 µM |
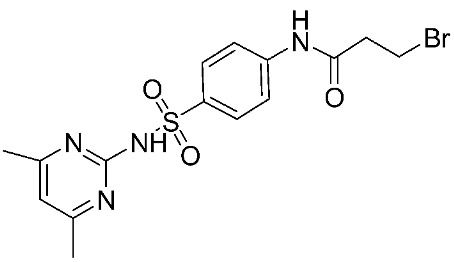
|
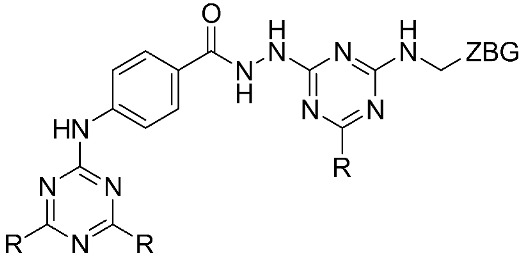
| Compound 4 [80] | MCF-7 | IC50 = 6.9 ± 0.5 nM |
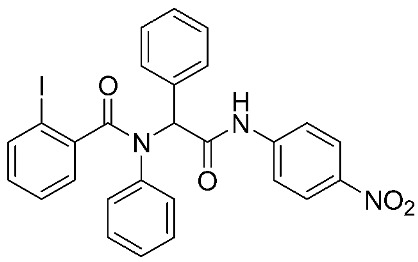
|
| NFS-60 | IC50 = 5.5 ± 0.6 nM | ||
| HepG-2 | IC50 = 3.1 ± 0.4 nM | ||
| Compound 5 [80] | MCF-7 | IC50 = 3.6 ± 0.4 nM |
|
| NFS-60 | IC50 = 3.61 ± 0.1 nM | ||
| HepG-2 | IC50 = 2.2 ± 0.1 nM | ||
| Compound 6 [80] | MCF-7 | IC50 = 6.6 ± 0.7 nM |
|
| NFS-60 | IC50 = 5.8 ± 0.2 nM | ||
| HepG-2 | IC50 = 5.7 ± 1 nM | ||
| Compound 7 [81] | HCT116 | IC50 = 7.403 ± 0.201 nM |
|
| Compound 8 [82] | MDA-MB231 | IC50 = 3.8 ± 0.7 nM |
|
| Caco-2 | IC50 = 3.3 ± 0.5 nM |