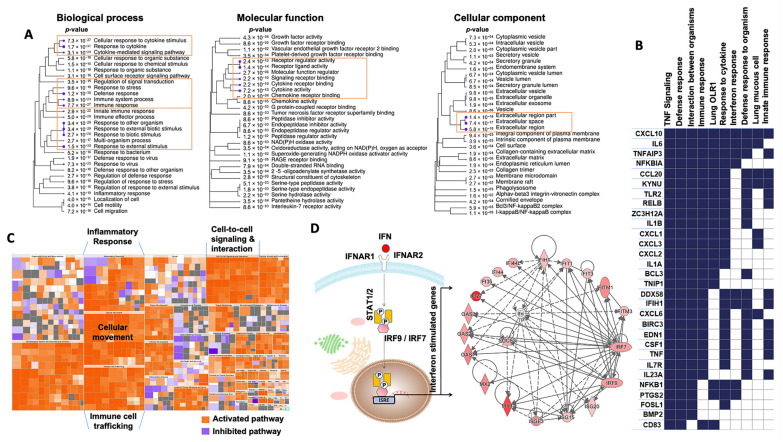
Figure 2.
Analysis of GO terms enriched in the unique bulk RNA-seq signature of the ALI model at day 1 post-infection by SARS-CoV-2. (A) Pathway enrichment analyses were performed with human gene names. The size of the blue dots corresponds to the enrichment (FDR), and bigger dots indicate more significant p-values. The biological process, molecular function and cellular component categories revealed the high enrichment of immune response and cytokine/chemokine activities upon SARS-CoV-2 infection. (B) GSEA performed using the unique bulk RNA-seq signature upon SARS-CoV-2 infection. The heat map shows the (clustered) genes in the leading-edge subsets and the dynamic expression of genes involved in immune response, interferon response, defense response, TNF signaling and response to cytokines. (C) Enrichment heat map (IPA) showing the dynamic activity of canonical pathways after SARS-CoV-2 infection. Each colored rectangle is a biological function, and the color range indicates its activation state (orange for an activated pathway with Z-score > 2 and blue for an inhibited pathway with Z-score < −2). The pathways were classified into different types according to the IPA database. (D) The network shows the interactions of interferon (IFN)-stimulated genes. Nodes shaded in pink represent protein-coding genes that are upregulated in the ALI model upon SARS-CoV-2 infection. Labels in nodes and edges (lines) illustrate the nature of the relationship between genes and their functions. A dotted line represents an indirect interaction and a solid line a direct interaction. IPA, Ingenuity Pathway Analysis. GO, Gene Ontology.

