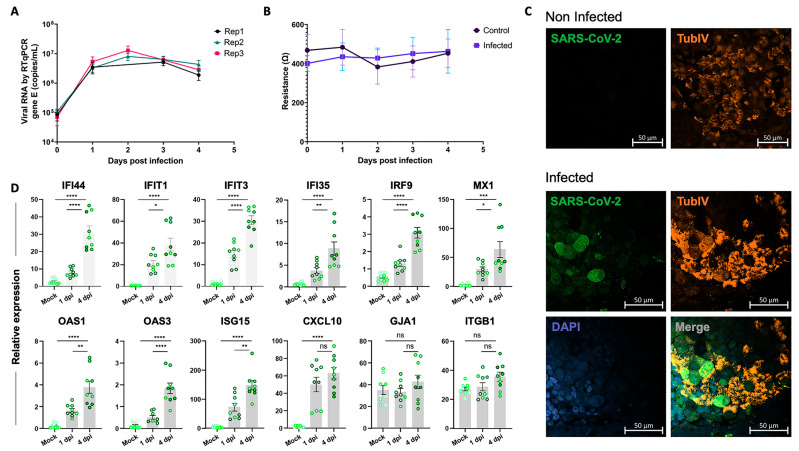
Figure 4.
Validation of SARS-CoV-2 infection in the iALI model. (A) iALI cultures were infected with SARS-CoV-2 Delta with MOI (multiplicity of cellular infection) = 0.05. Then, viral RNA was extracted from apical wash samples, and viral gene E was quantified via RT-qPCR (copies/mL). Data are from three independent experiments (Replicate-1, replicate-2, replicate-3) using three different iALI cultures. The standard deviation shows the result variability. (B) Transepithelial electric resistance (TEER) measurements of infected iALI cultures and controls. (C) Non-infected and SARS-CoV-2 Delta (MOI = 0.05)-infected iALI cultures were stained with anti-SARS-CoV-2 M protein (viral membrane protein, green), anti-α-tubulin (ciliated cell marker, orange) and anti-P63 (basal cell marker, red) antibodies. Nuclei were counterstained with DAPI (blue). SARS-CoV-2 was identified on the motile cilia. Scale bar: 20 µm. (D) RT-qPCR analysis of the expression of genes encoding inflammatory and interferon-related factors in iALI cultures infected with SARS-CoV-2 (MOI 0.05) at 1 dpi and 4 dpi. Data are the mean ± SEM of three independent experiments with three technical replicates/each (9 samples); * p < 0.05, ** p < 0.01, *** p < 0.001, **** p < 0.0001, ns: not significant (Student’s t test). MOI: multiplicity of cellular infection.

