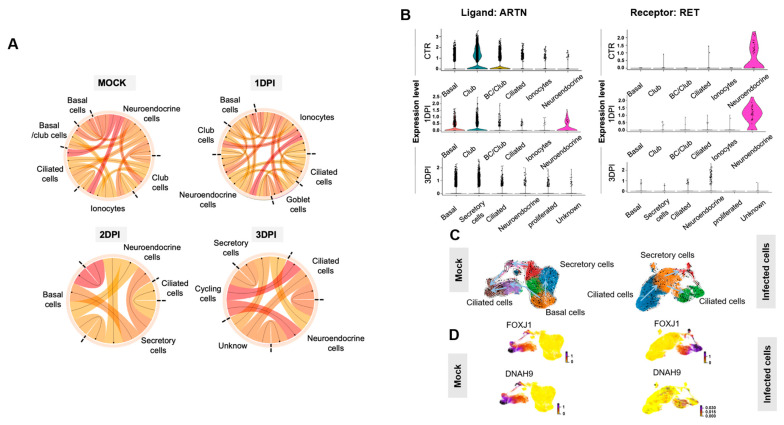
Figure 5.
Paracrine interactions and single-cell trajectories in SARS-CoV-2-infected ALI cultures. (A) Circos plot showing potential interactions (ligand receptors) between various epithelial cell types in non-infected (Mock) and SARS-CoV-2-infected ALI cultures at 1, 2 and 3 dpi. The smallest number of paracrine interactions was observed in infected cultures at 2 and 3 dpi. Arrows point to the receptors. (B) Violin plots showing the expression of the ligand ARTN and its receptor RET in the various airway cell types identified by scRNA-seq before (Mock) and after SARS-CoV-2 infection (1 and 3 dpi). (C) The velocity field revealed two distinct tracks used by basal cells to form ciliated cells in non-infected ALI cultures (mock) but not in SARS-CoV-2-infected cultures (2 dpi). (D) Left, gene expression of known markers of premature (FOXJ1+) and mature ciliated cells (DNAH9+) is visualized on the t-SNE plot in the mock sample. Right, the t-SNE plot shows the absence of mature ciliated cells (DNAH9+) at 2 dpi.

