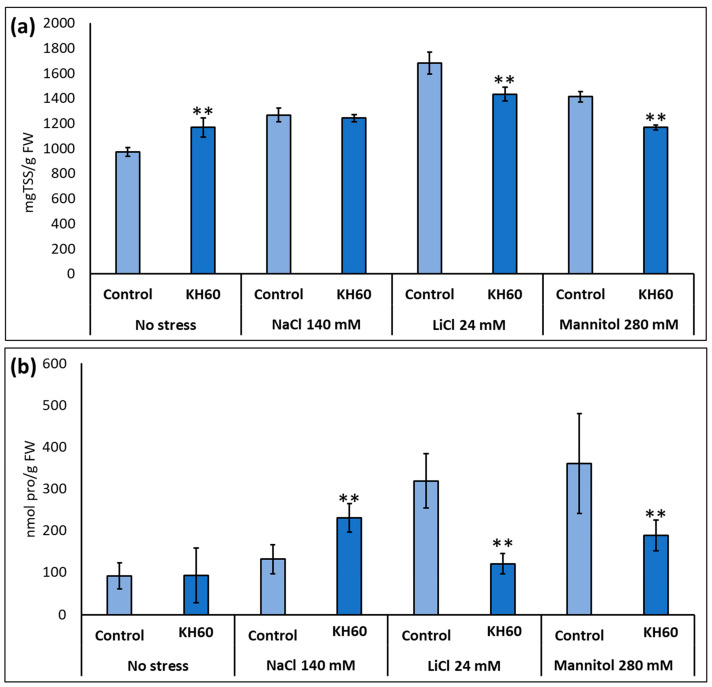
Figure 4.
Accumulation of osmolytes under abiotic stress. (a) Total soluble sugars (TSS) and (b) proline (pro). The X-axis indicates the different concentrations of abiotic stressors. The Y-axis represents (a) mg TSS per gram of fresh weight (FW) and (b) nmols of proline per gram of fresh weight (FW). n = 6 for each individual bar. Bars represent the standard error. ** p < 0.01 by Student’s tests for the target sample compared to the control sample.

