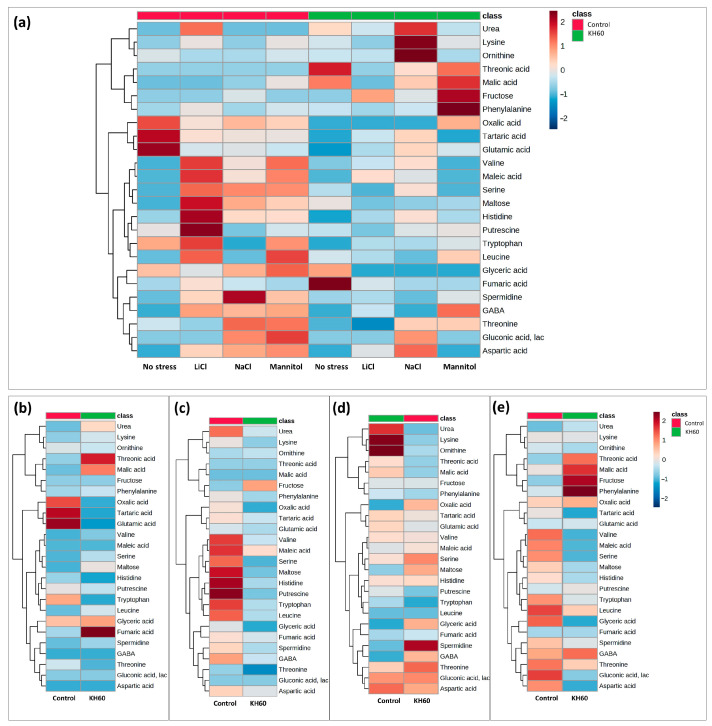
Figure 6.
Hierarchical clustering analysis of the correlation between each of the measured A. thaliana metabolites and four tested conditions. (a) Comparative analysis of the accumulation patterns under the four tested conditions (normal, saline (NaCl and LiCl), and osmotic stress (mannitol)) and presence or absence of potassium humate (KH60). Cluster analysis of accumulated metabolites under (b) normal, (c) 24 mM LiCl, (d) 140 mM NaCl, and (e) 280 mM mannitol conditions. Different color scales represent different relative metabolite levels; red indicates up-accumulation and blue indicates down-accumulation of metabolites. n = 4 for each condition.

