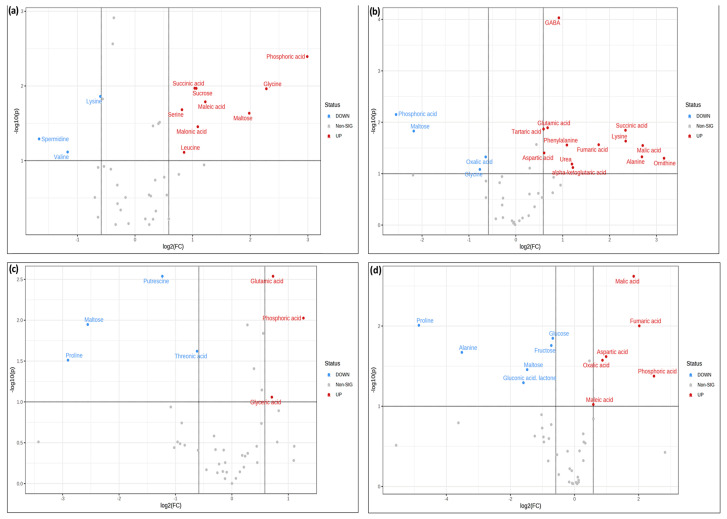
Figure 8.
Volcano plot analysis of metabolic changes under (a) normal, (b) 140 mM NaCl, (c) 24 mM LiCl, and (d) 280 mM mannitol conditions. A comparison of the samples containing KH60 with respect to the control samples without potassium humate was made to obtain significantly differentially accumulated metabolites. The X-axis indicates fold change threshold (FC ≥ 1.5), while the Y-axis represented the t-test threshold (p-value ≤ 0.05). Different colors represent different relative metabolite levels; red indicates significant up-accumulation and blue indicates significant down-accumulation of metabolites. Grey points represent metabolites for which no significant changes were observed.

