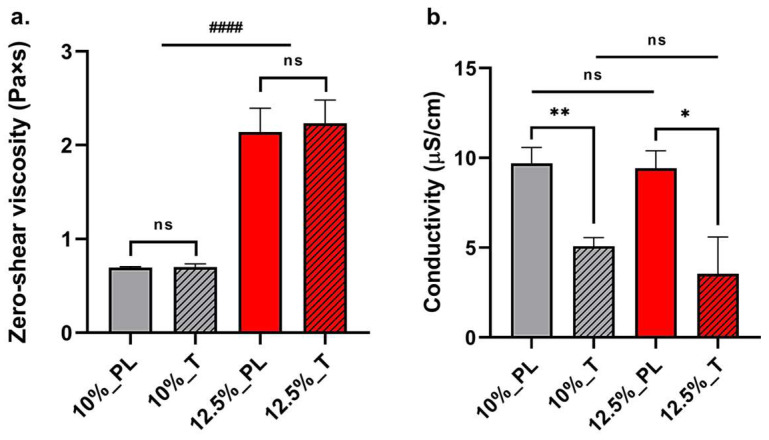
Figure 2.
(a) Average zero-shear viscosity ± standard deviation (n = 3) and (b) average conductivity ± standard deviation (n = 3) of 10% w/v PLGA placebo solution (10%_PL), 10% w/v PLGA 0.2% w/wPLGA tobramycin-doped polymer solution (10%_T), 12.5% w/v PLGA placebo solution (12.5%_PL), 12.5% w/v PLGA 0.2% w/wPLGA tobramycin-doped polymer solution (12.5%_T). Statistical analysis was performed between placebo and tobramycin-doped polymer solutions with same concentration and between 10% and 12.5% w/v PLGA concentration groups (parametric t-test between PL and T: statistical significance is represented as * for p < 0.05, ** for p < 0.01, otherwise non-statistical significant (ns); parametric t-test between 10% and 12.5% w/v PLGA concentration groups: statistical significance is represented as #### for p < 0.001).

