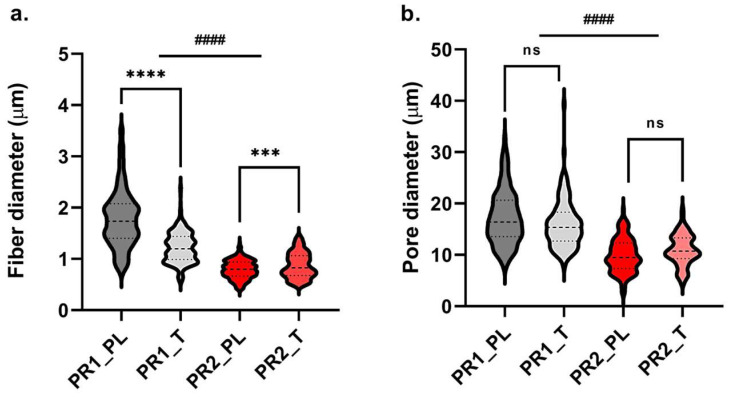
Figure 4.
Fibre (a) and pore (b) diameter distributions of PR1_PL and PR1_T, and PR2_PL and PR2_T. Central dashed line is median, lower dotted line is first quartile, upper dotted line is third quartile (for fibre diameter n = 200; for pore size n = 180). Statistical analysis was performed between placebo and tobramycin-doped grafts of the same prototype, and between PR1 and PR2 graft groups if non-statistical differences were detected among placebo and tobramycin-loaded grafts (parametric t-test between PL and T: statistical significance is represented as *** for p < 0.005, **** for p < 0.001, otherwise non-statistical significant (ns); parametric t-test between PR1 and PR2 groups: statistical significance is represented as #### for p < 0.001).

