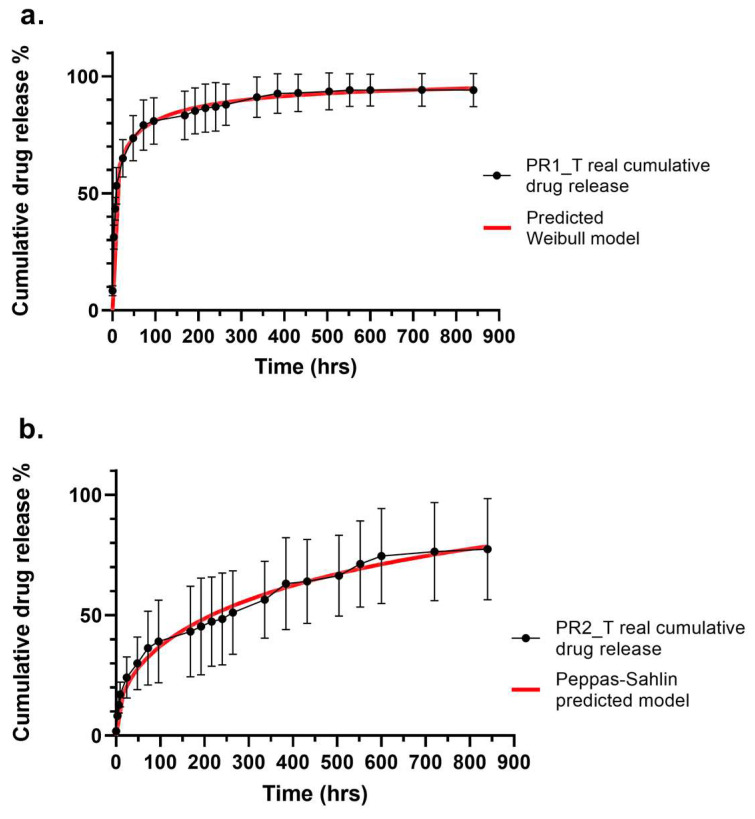
Figure 7.
Superimposed real (black) and predicted (red) cumulative drug release profiles of (a) Prototype 1 and (b) Prototype 2. Real drug release data were reported as average ± standard deviation (n = 5); predicted drug release data reported as average (n = 5). Standard deviation was equal to 8% for Weibull predicted data, and equal to 20% for Peppas–Sahlin predicted data.

