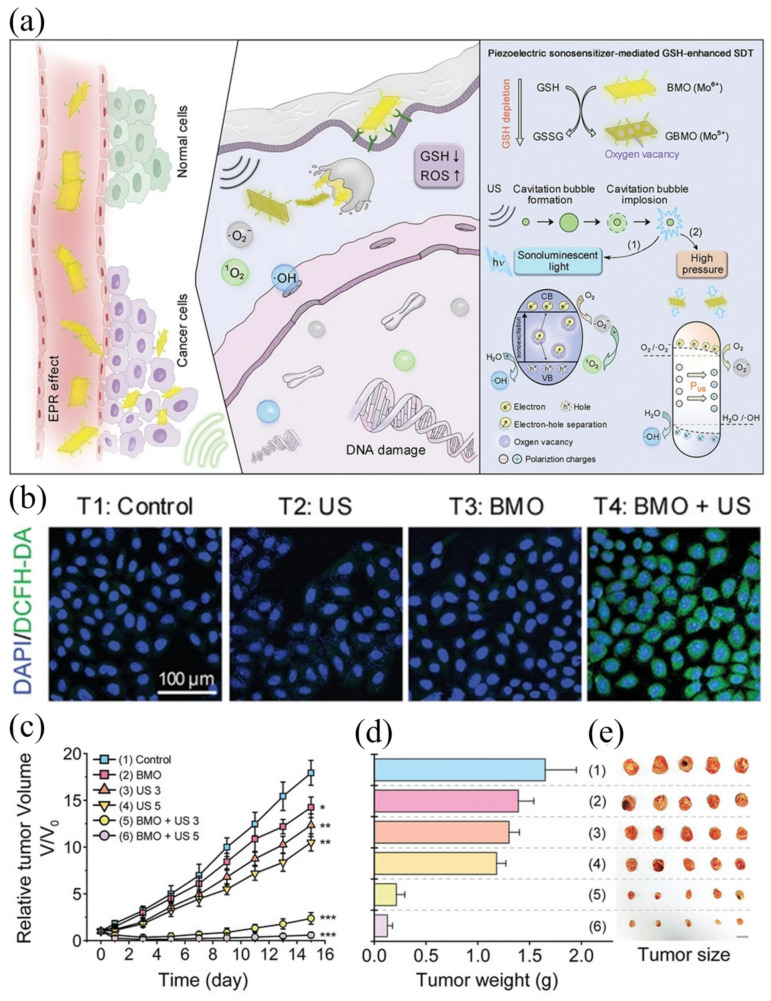
Figure 6.
(a) Schematic diagram of the 2D piezoelectric Bi2MoO6 sonosensitizer for GSH−enhanced sonodynamic therapy; (b) intracellular ROS level with BMO NRs for 4 h followed by various treatments; (c) relative tumor growth curves of tumor-bearing mice after different treatments; (d) the average weights; and (e) photo of tumors dissected from the representative mice 15 d after various treatments [77]. *, ** and *** in this figure means: * p < 0.01, ** p < 0.005, *** p < 0.001.

