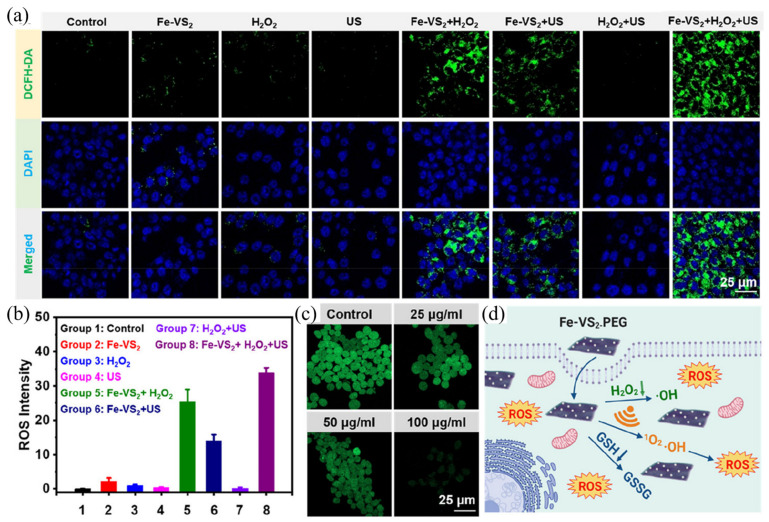
Figure 8.
(a) Laser scanning confocal microscope images of ROS production in different control groups; (b) intracellular levels of reactive oxygen species production; (c) laser scanning confocal microscope images of tumor cells and nanocomposites stained after incubation; (d) cell killing mechanism of nanocomposites [113].

