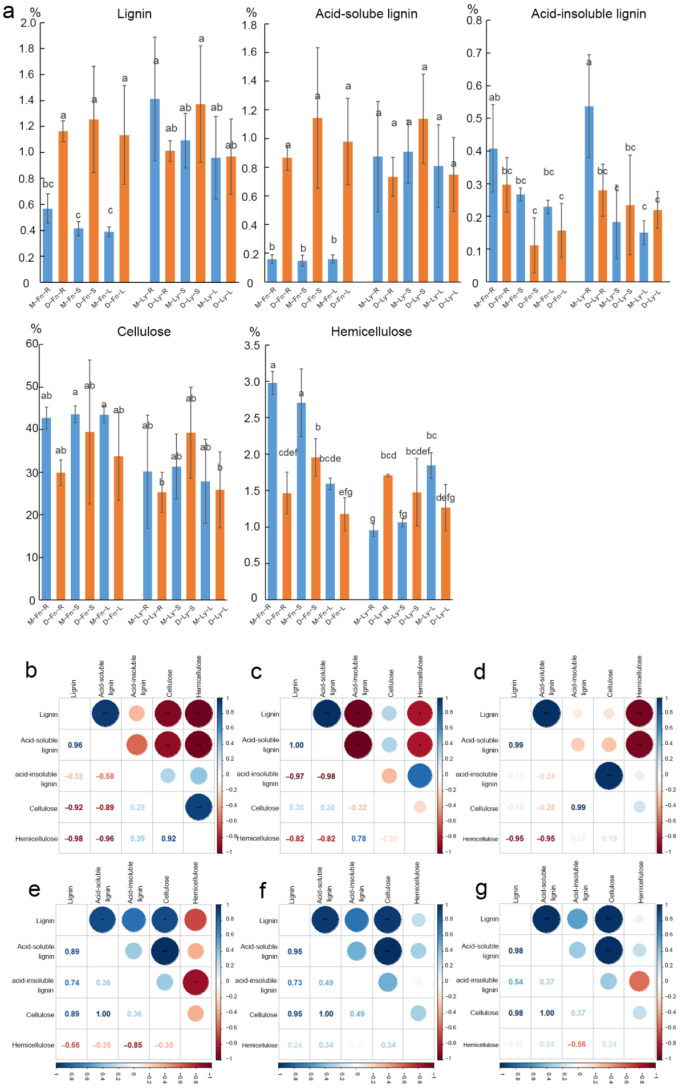
Figure 3.
(a) The levels of lignin, cellulose, and hemicellulose were compared between Fany and Longya10 flax plants under drought stress conditions. Statistical significance between the two columns is indicated by different letters, representing a significant difference at p < 0.05. The abbreviations M-Fn and M-Ly represent flax growth in the mock condition derived from Fany and Longya10 flax, respectively. D-Fn and D-Ly represent flax growth in the stress condition derived from Fany and Longya10 flax. -R represents the root organ of flax, -S represents the stem, and -L represents the leaves organ of flax, respectively. (b) Correlation analysis was conducted in the roots of Fany flax plants. (c) Correlation analysis was performed in the stems of Fany flax plants. (d) Correlation analysis was carried out in the leaves of Fany flax plants. (e) Correlation analysis was conducted in the roots of Longya10 flax plants. (f) Correlation analysis was performed in the stems of Longya10 flax plants. (g) Correlation analysis was carried out in the leaves of Longya10 flax plants. Asterisks (*) are used to denote statistical significance at p < 0.05, while double asterisks (**) indicate significance at p < 0.01.

