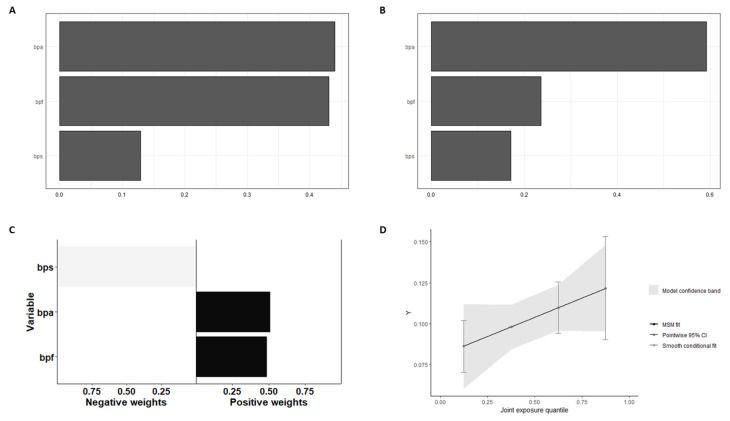
Figure 1.
Weighted quantile sum and quantile G-computation analysis of urinary BPmix in Heart Disease: (A) Weights from weighted quantile sum regression for the mixture of bisphenols and HD risk, without confounders adjust. (B) Weights from weighted quantile sum regression for the mixture of bisphenols and HD risk, adjust the positive WQS regression model for confounders. (C) Weights corresponding to the proportion of the positive or negative partial effect per chemical in the quantile g-computation model. (D) Model fitting using Bootstrap. Note that the number of iterations was 200. The graph of this model estimates the general effect of the mixture.

