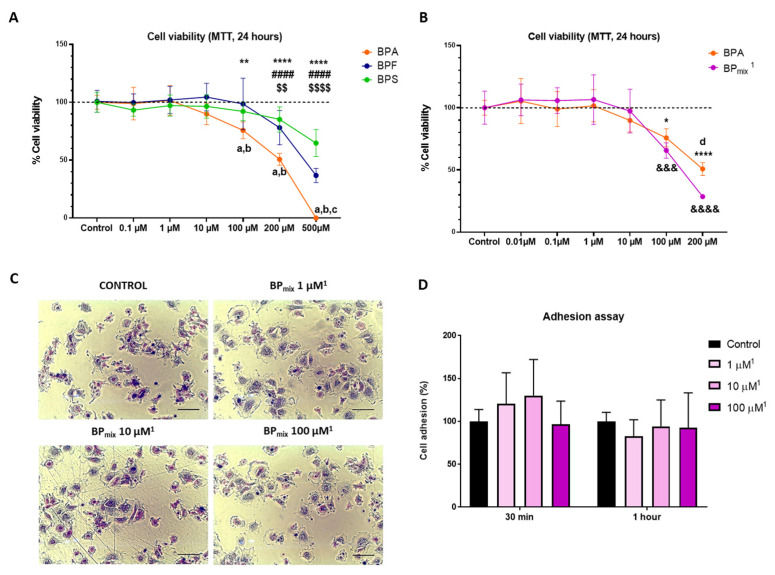
Figure 3.
Graphic representation of exposure to PBs on cell viability (MTT assay) and cell adhesion: (A) Cell viability effect of individual exposure. (B) Comparison between the individual effect of BPA and the combined effect of the three bisphenols (BPmix). Two-Way ANOVA followed by Tukey’s multiple comparisons test, Sidak’s multiple comparisons test, or Dunnett’s multiple comparisons test was performed, as appropriate. (C) Representative photomicrographs of the adhesion test at 60 min. Scale bar = 100 µm. (D) Graphic representation of cell adhesion assay. The graph includes the average values of the results of the adhesion tests at 30 and 60 min. 1 The concentrations expressed in the figures indicate the concentration of BPA used. In addition, the corresponding proportions of BPF and BPS were added based on average data obtained from the NHANES cohort: BPA (1): BPF (0.38): BPS (0.36). The results were represented as mean (standard deviation). * represents a significant difference between the BPA group and its respective control (* p-value ≤ 0.05, ** p-value ≤ 0.01, **** p-value ≤ 0.0001). # represents a significant difference between the BPF group and its respective control (#### p-value ≤ 0.0001). $ represents a significant difference between the BPS group and its respective control ($$ p-value ≤ 0.01, $$$$ p-value ≤ 0.0001). & represents a significant difference between the BPA + BPF + BPS group and its respective control (&&& p-value ≤ 0.001, &&&& p-value ≤ 0.0001). The letter “a” indicates a significant difference between BPA and BPF; “b” between BPA and BPS; “c” between BPF and BPS; “d” between BPA and BPA + BPF + BPS.

