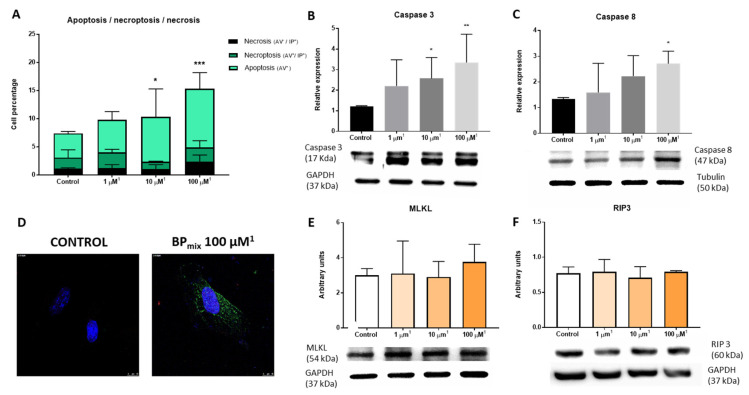
Figure 4.
Cell death study by flow cytometry, Western blot, and immunofluorescence: (A) Flow cytometry: annexin V (AV) and propidium iodide (PI) assay. Two-Way ANOVA was performed, followed by Tukey’s multiple comparisons test, Sidak’s multiple comparisons test, or Dunnett’s multiple comparisons test, as appropriate. (B) Western blot of Caspase-3. (C) Western blot of Caspase-8. (D) Immunofluorescence of caspase-3. Scale bar = 10 µM. (E) Western blot of MLKL. (F) Western blot of RIP3. Kruskal–Wallis, followed by a Dunn’s test, was performed. The results were represented as mean (standard deviation. * p-value ≤ 0.05; ** p-value ≤ 0.01; *** is equivalent to a p-value ≤ 0.001. 1 The concentrations expressed in the graphical representation indicate the concentration of BPA used. In addition, the corresponding proportions of BPF and BPS were added based on average data obtained from the NHANES cohort: BPA (1): BPF (0.38): BPS (0.36).

