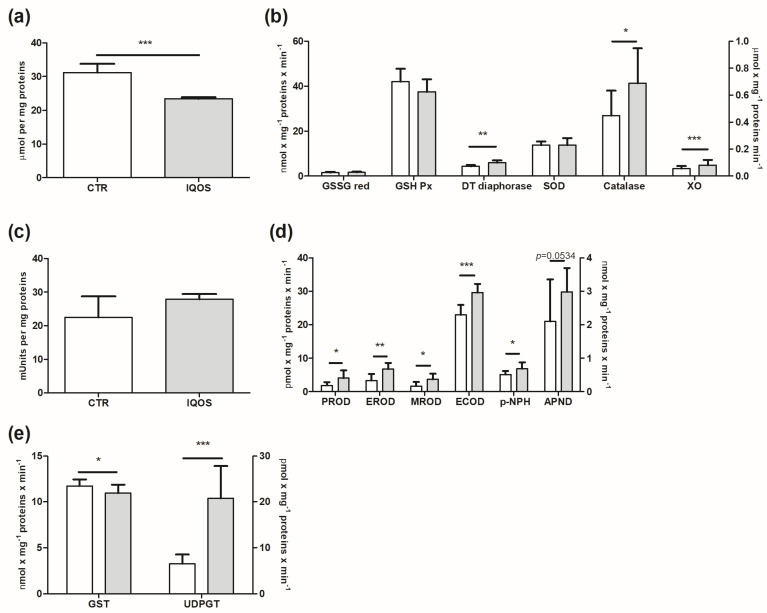
Figure 2.
Total variations in GSH and antioxidant enzymatic systems, monooxygenases and phase II enzymes in rat liver following IQOS exposure. (a) Total amount of GSH. (b) GSSG red, GSH Px, DT−diaphorase, SOD (left y axis), catalase and XO (right y axis). (c) COX. (d) Phase I enzymes: PROD (CYP2B1/2), EROD (CYP1A1), MROD (CYP2A1), ECOD (not specific, CYP1A1, 1A2 and 2B) (left y axis); pNPH (CYP2E1) and APND (right y axis). (e) GST and UDPGT. Data are expressed as mean ± S.D. p < 0.05 *, p < 0.01 **, p < 0.001 ***.

