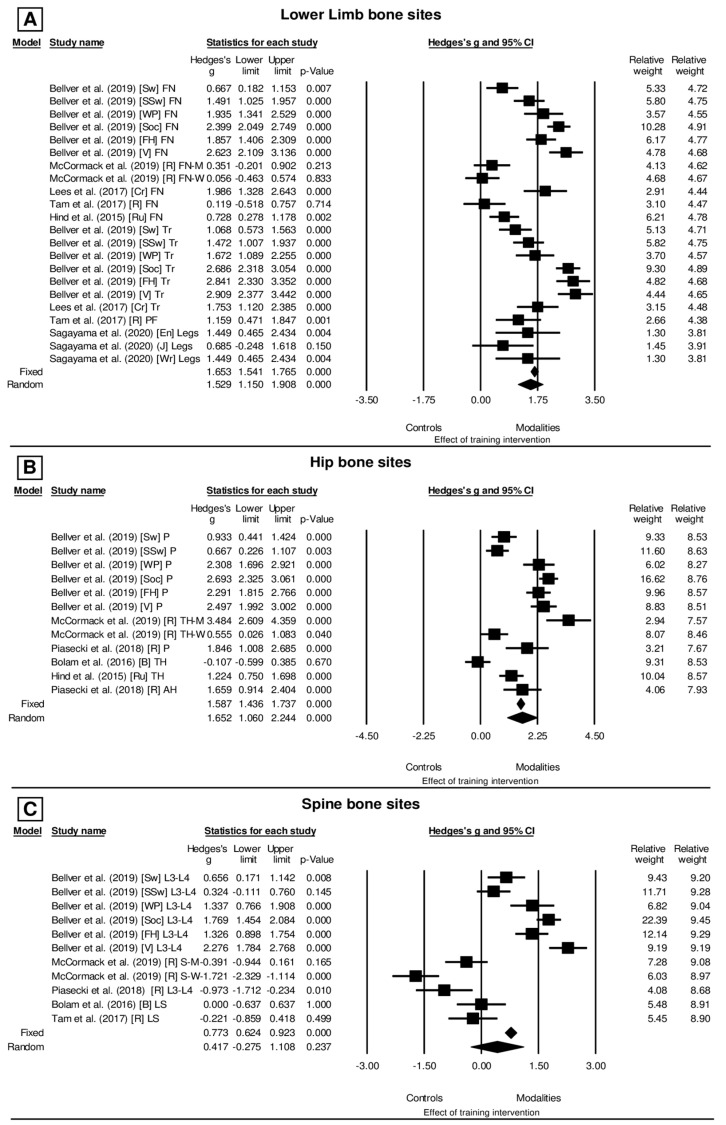
Figure 2.
(A–C) Forest plot of the effect size for the values of BMD reported for each bone site, according to the exercises or sports analysed in the current study. Obs.: FN: Femoral Neck, Tr: Trochanter, PF: Proximal Femoral, P: Pelvis, TH: Total Hip, AH: Average Hip, L3-L4: Lumbar Vertebrae 3–4, LS: Lumbar Spine, Legs: Both Legs, S-M: Lumbar Man, S-W Lumbar Woman, Sw: Swimmers, SSw: Synchronized Swimmers, WP: Water Polo, S: Soccer, FH: Field Hockey, V: Volleyball, Cr: Cricket, R: Running, Ru: Rugby, B: Boxing, Wr: Wrestlers, J: Judo, En: Endurance Athletes. The markers represent the effect size and 95% CI.

