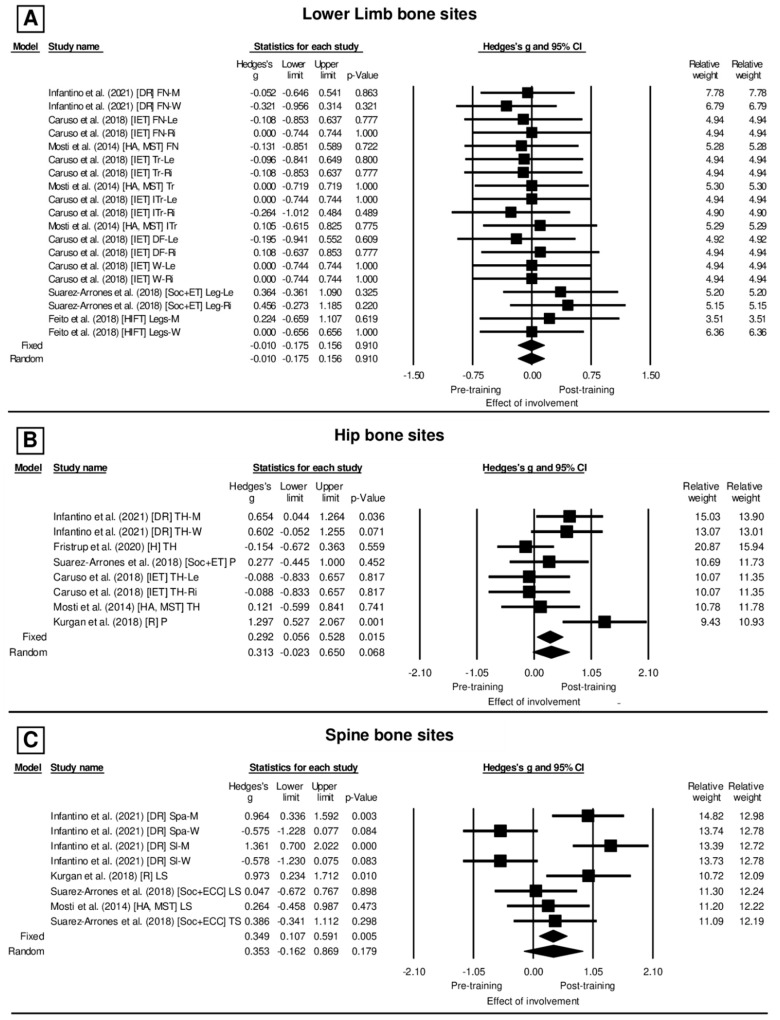
Figure 3.
(A–C) Forest plot of the effect size for the BMD alterations in each bone site, according to the exercises or sports analysed in the current study: FN: Femoral Neck, FN-Le: Femoral Neck Left, FN-Ri: Femoral Neck Right, Tr-Le: Trochanter Left, Tr-Ri: Trochanter Right, Tr: Trochanter, ITr-Le: Inter Trochanter Left, ITr-Ri: Inter Trochanter Right, ITr: Inter Trochanter, DF-Le: Distal Femur Left, DF-Ri: Distal Femur Right, W-Le: Ward Triangle Left, W-Ri: Ward Triangle Right, Legs-W: Legs Women, Legs-M: Legs Men, P: Pelvis, TH-Le: Total Hip Left, TH-Ri: Total Hip Right, LS: Lumbar Spine, TS: Thoracic Spine, Spa: Anterior–Posterior Spine, SI: Lateral Spine, EIT: Inertial Exercise Trainer, HA: High Acceleration, MST: Maximal Strength Training, Soc: Soccer + ET: Eccentric-overload Training, HIFT: High Intensity Functional Training, IET: Inertial Exercise Trainer, R: Running, and DR: Distance Runners. The markers represent the effect size and 95% CI.

