Figure 2.
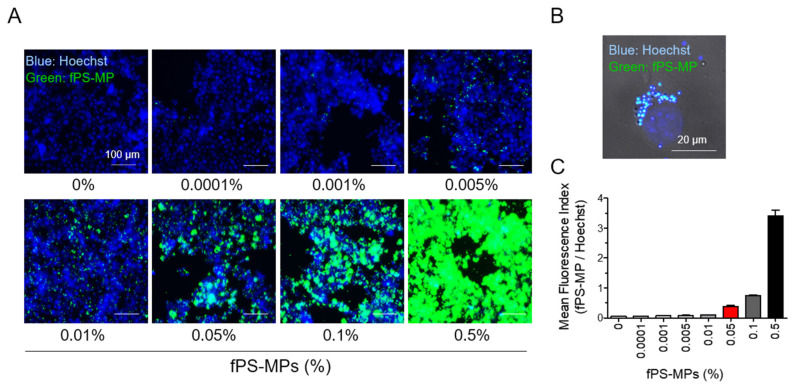
Uptake of fPS-MPs by BV2 microglial cells. BV2 cells were incubated with different concentration of fPS-MPs (0–0.5%) for 24 h and visualized under a fluorescence microscope. (A) Representative images taken with the iRiS Digital Cell Imaging System. fPS-MPs (green) are bound to microglial cells (nuclei, blue, Hoechst). Scale bar: 100 µm. (B) Confocal image of 0.05% fPS-MP-treated microglial cells. Differential interface contrast (DIC) images were overlaid with green (fPS-MP) and blue (Hoechst) fluorescence images. Scale bar: 20 µm. (C) Dose-dependent graph of mean fluorescence index (fPS-MP/Hoechst).

