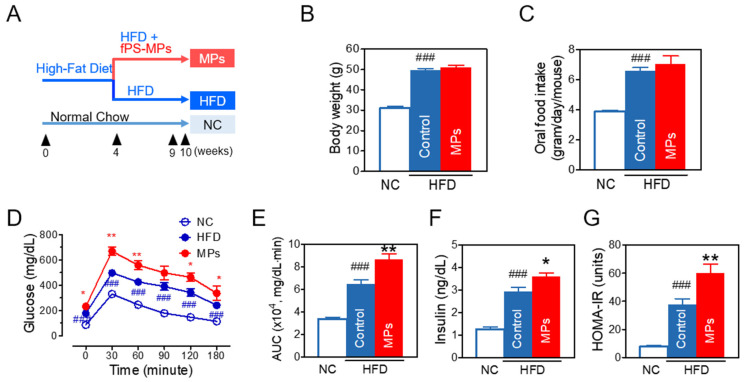
Figure 3.
Effects of fPS-MPs on metabolic parameters in HFD-induced obese mice. (A) Experimental scheme in vivo; (B) body weight at the end of the experiment; (C) oral food intake; (D) time-course changes of blood glucose in the oral glucose tolerance test (OGTT) at 9 weeks; (E) area under the curve (AUC) of the OGTT; (F) fasting insulin; (G) homeostatic model assessment of insulin resistance (HOMA-IR); (H) cholesterol (Total-C, LDL-C, HDL-C); (I) liver function enzymes of AST and ALT; (J) renal function marker of creatinine. Data are expressed as the mean ± SEM (n = 5). ## p < 0.01 and ### p < 0.001 vs. NC, and * p < 0.05 and ** p < 0.01 vs. HFD-control. NC, normal chow; Control, HFD-control; MPs, HFD plus fPS-MPs 0.125 µg/mouse per day.


