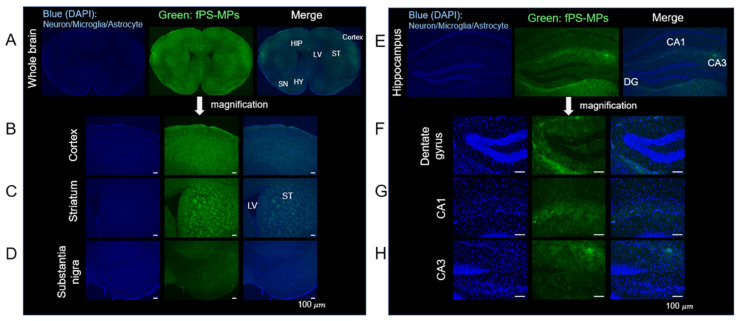
Figure 7.
fPS-MP deposition in the brain. Green, fluorescent particles were detected in most regions of the brain. Representative images taken with the iRiS Digital Cell Imaging System are shown. Brain coronal sections from HFD-induced obese mice treated orally with fPS-MPs (0.125 µg/mouse per day) for 6 weeks show fPS-MPs (green) bound to cells (nuclei, blue, Hoechst). Scale bar: 100 µm. Regions marked: (A) whole brain (HY, hypothalamus; LV, lateral ventricle); (B) cortex; (C) striatum (ST); (D) substantia nigra (SN); (E) hippocampus (HIP); (F) dentate gyrus (DG); (G) hippocampal CA1; and (H) hippocampal CA3.

