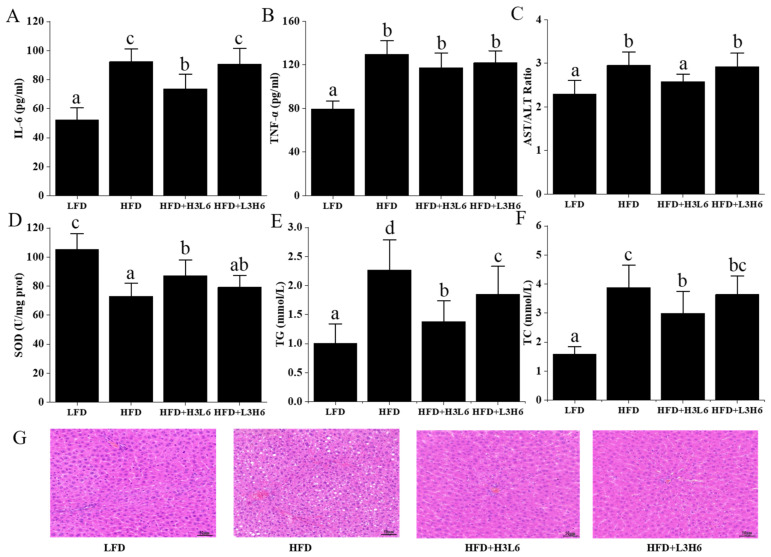
Figure 3.
The effect of a low LA/ALA ratio on the liver. (A) IL-6; (B) TNF-α; (C) AST/ALT ratio; (D) SOD; (E) TG; (F) TC; (G) liver morphology (H&E). Different letters indicate significant differences (p < 0.05) between each group, and the same letters indicate that there is no significant difference (p > 0.05) between each group.

