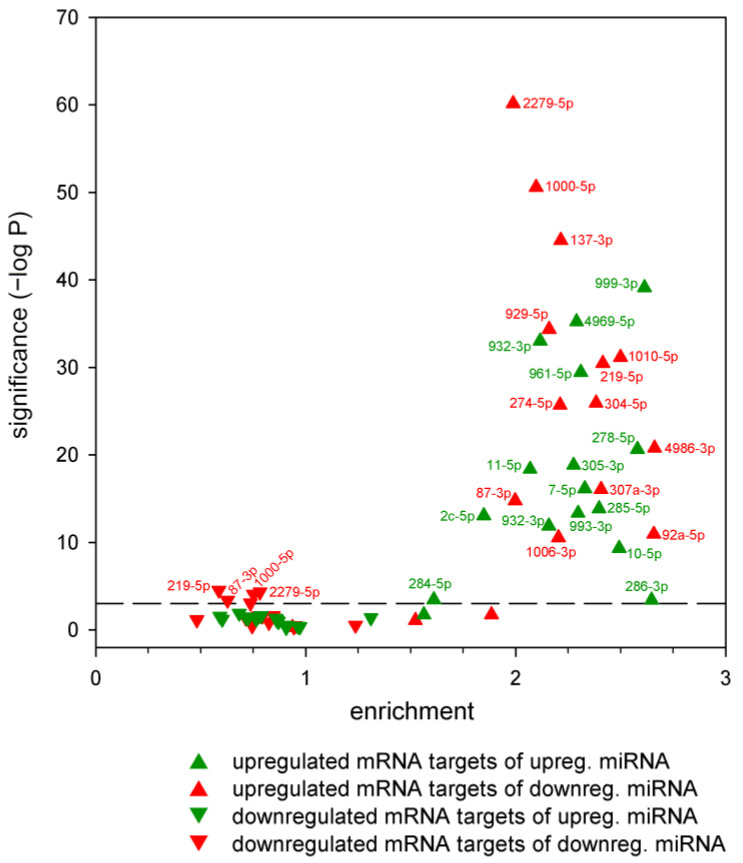
Figure 5.
Enrichment analysis of putative targets of dysregulated miRNAs in the sets of up- and downregulated mRNAs in the HD model. Statistical significance of enrichment/depletion was calculated with hypergeometric test, the dashed reference line marks Bonferroni correction adjusted α = 0.05 level (7.81 × 10⁻⁴). Enrichment values < 1 correspond with depletion.

