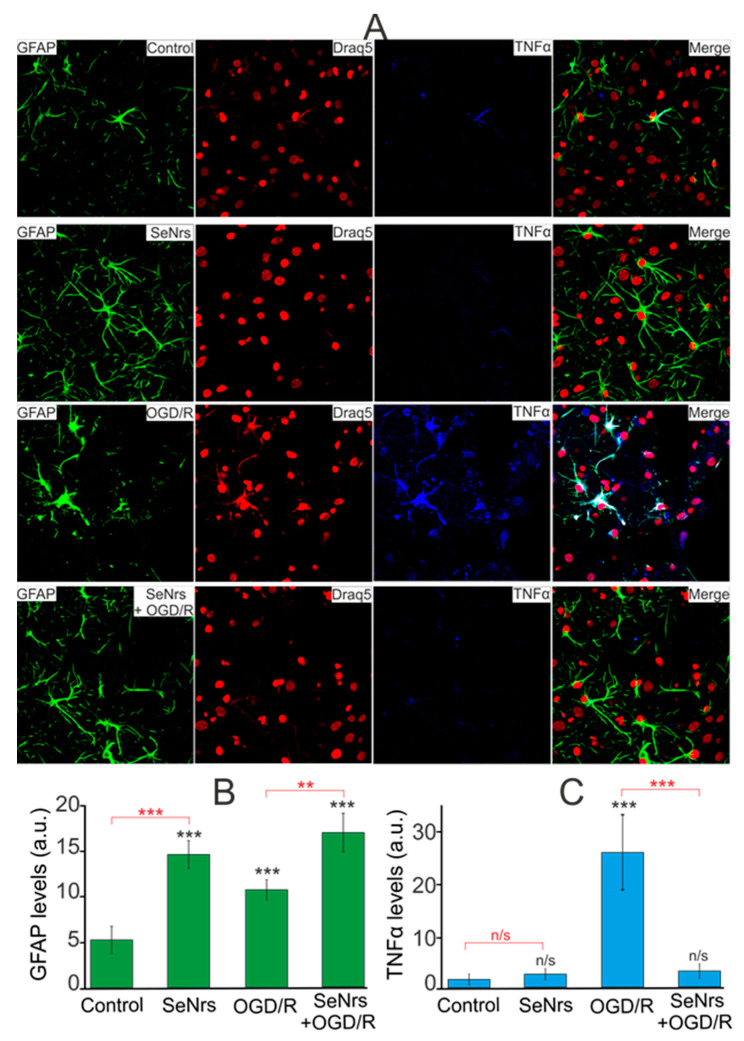
Figure 6.
Effect of 24-h preincubation of cortical astrocytes with 5 μg/mL SeNrs on baseline and OGD/R induced levels of tumor necrosis factor-alpha (TNFα) expression. (A) Immunostaining of glial fibrillary acidic protein (GFAP, green) and TNFα (blue) in cortical astrocytes in the control, after 24-h of incubation with 5 μg/mL SeNrs, after OGD/R and OGD/R after 24-h of incubation with SeNrs. Draq5 nuclei staining (red). (B,C) Intensity levels of GFAP (B) and TNFα (C) were determined by confocal imaging. We analyzed individual cells that had fluorescence of secondary antibodies. The quantitative data reflecting the level of GFAP or TNFα expression are presented as fluorescence intensity values in summary bar charts (mean +/− SEM). The values were averaged by 200 cells for each column. The results obtained after immunostaining agree well with the data of fluorescence presented in panel (A). Each value is the mean ± SE (n ≥ 3, p < 0.05). Statistical significance was assessed using paired t-tests. Comparison with control, *** p-level < 0.001, ** p < 0.01, n/s—data not significant (p > 0.05).

