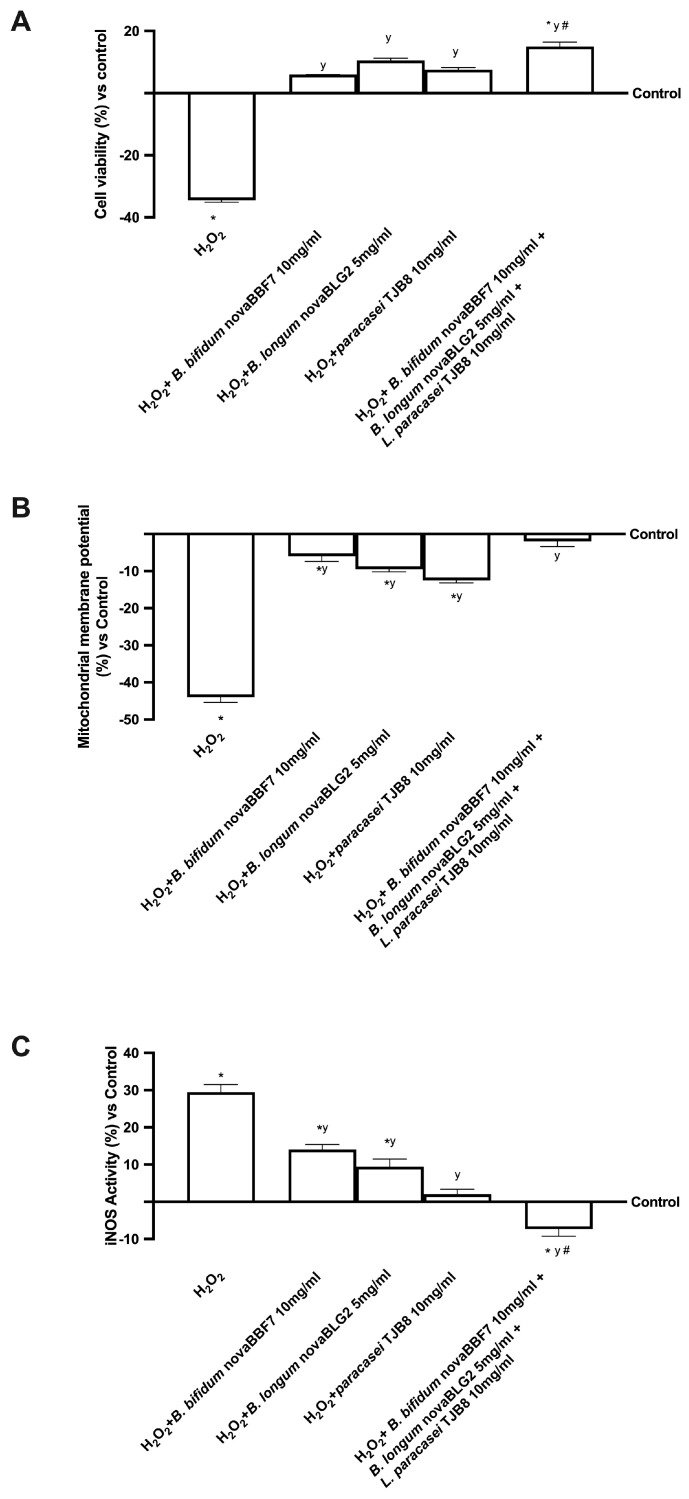
Figure 3.
Analysis of the mechanisms underlying cognitive functions under oxidative stress. Cell viability measured through MTT test (A); mitochondrial membrane potential (B); iNOS activity by ELISA kit (C) analysis. Data are expressed as mean ± SD (%) of 5 independent experiments normalised to control. * p < 0.05 vs. control; y p < 0.05 vs. H2O2; the bar # p < 0.05 vs. other agents.

