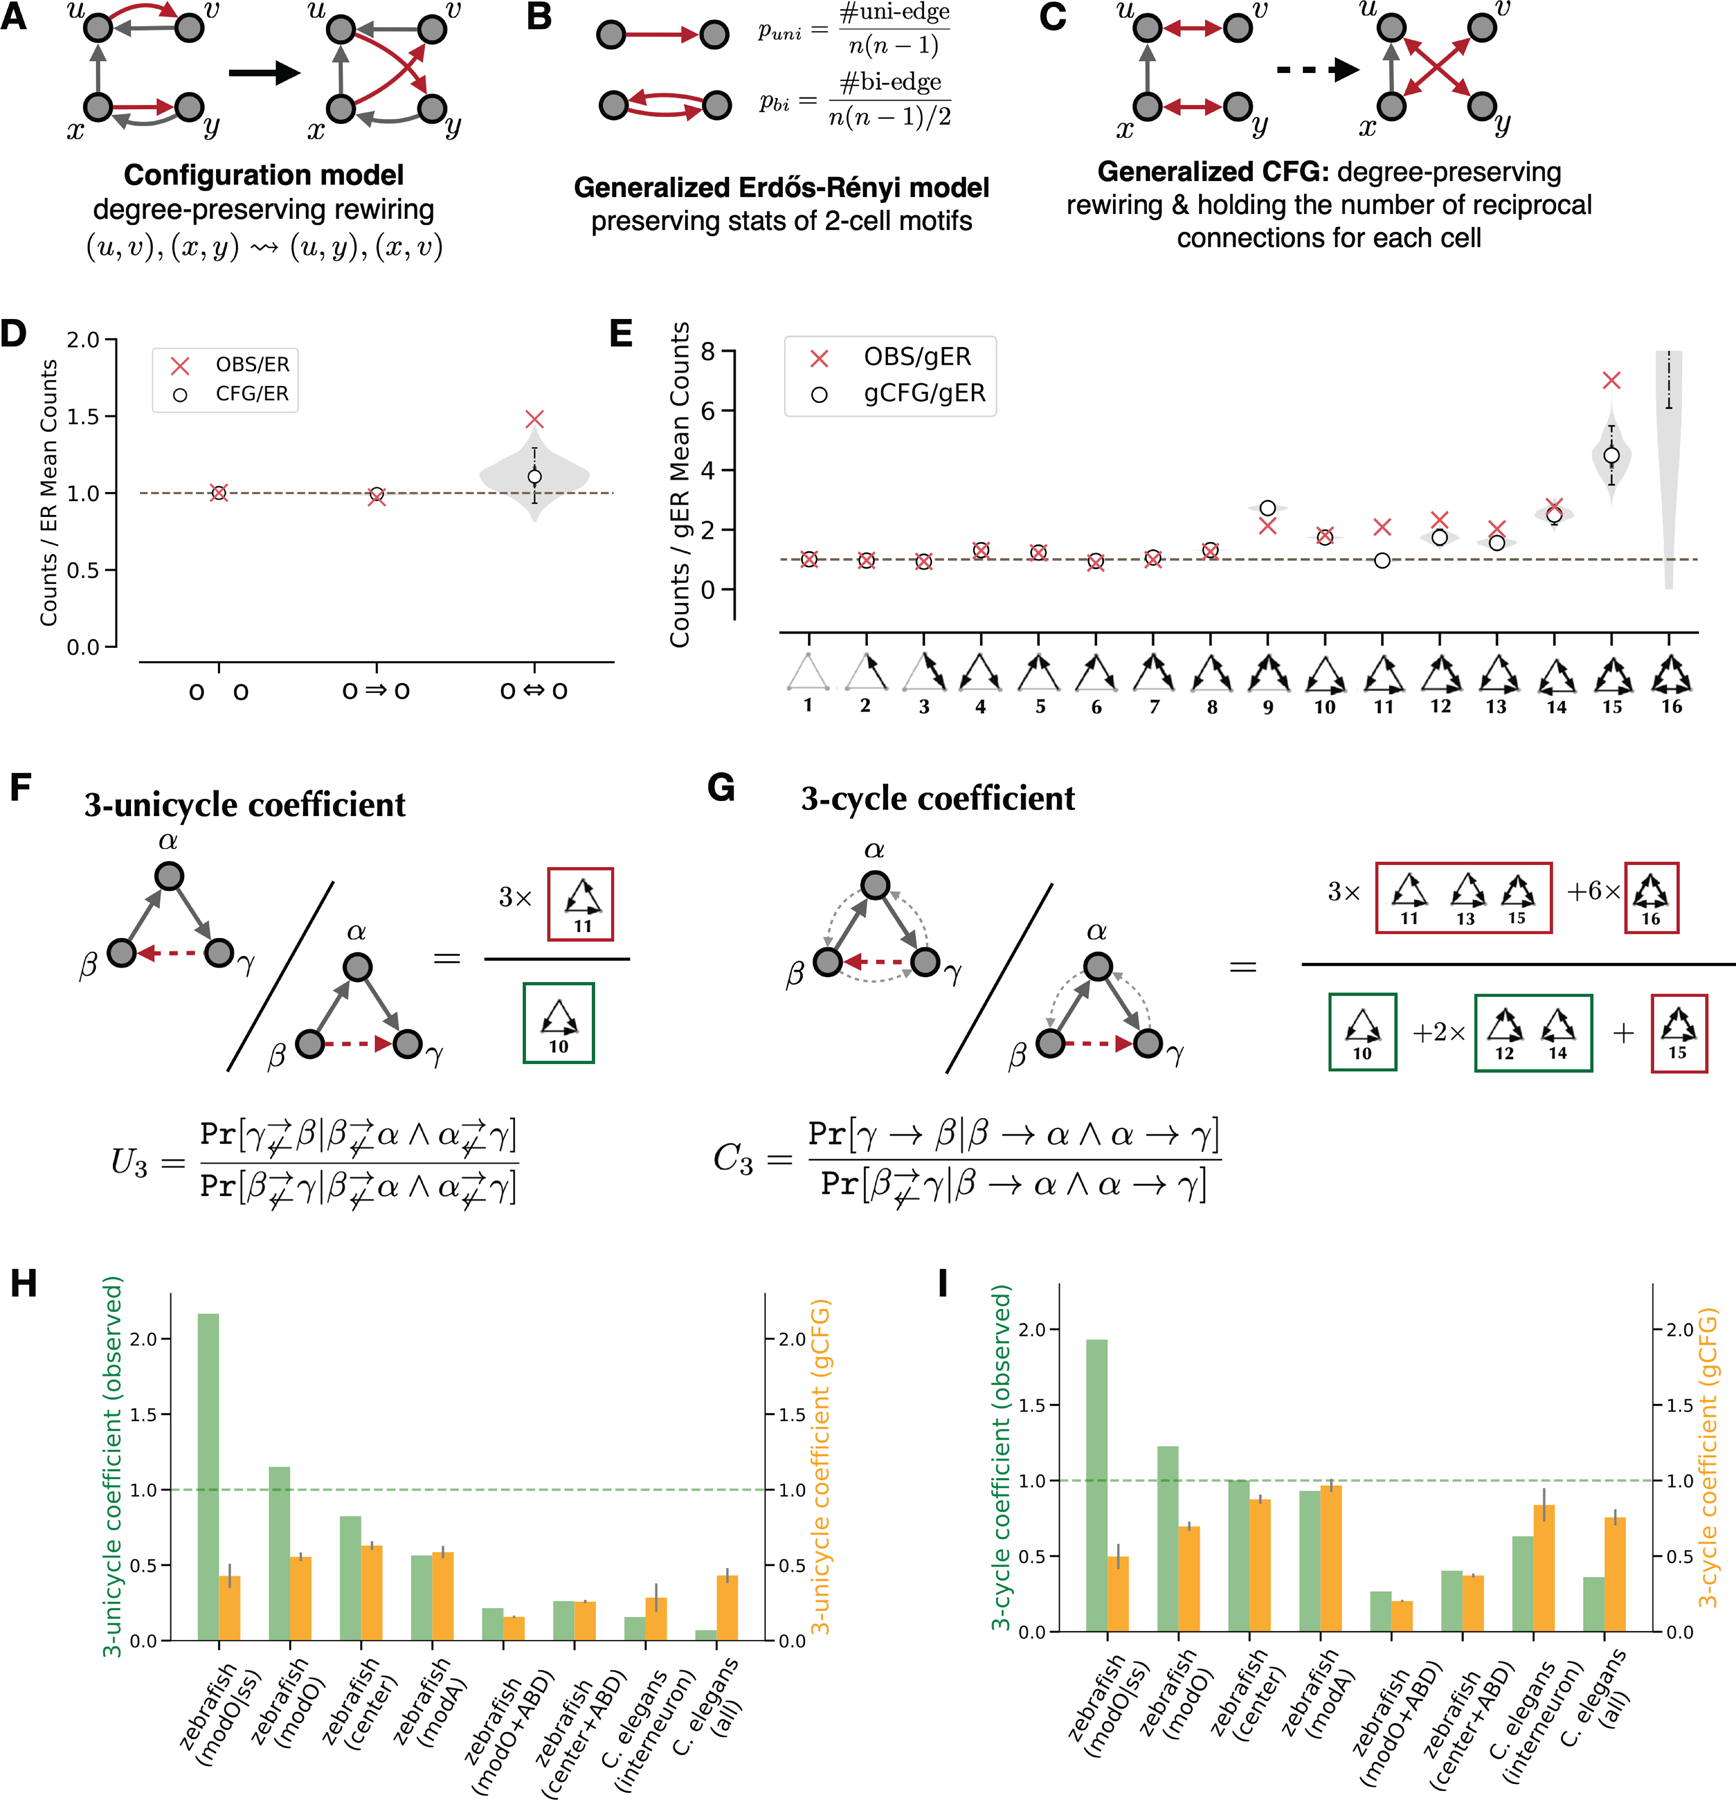
Figure 2.

Quantification of modO recurrence.
A. Illustration of the configuration model.
B. Illustration of the generalized ER model.
C. Illustration of the generalized CFG model.
D. 2-cell motif frequencies in modO and a configuration model (CFG) relative to the ER model. The shaded region shows the smoothed distribution of motif counts sampled from the configuration model. White points indicate medians, solid vertical lines indicate quartiles, and dashed lines indicate the 95% confidence interval for 1,000 samples.
E. 3-cell motif frequencies in the modO and the configuration model relative to a generalized ER model (gER). The violin plot shows the smoothed distribution of the motif counts sampled from the generalized configuration model (gCFG). White points indicate medians, solid vertical lines indicate quartiles, and dashed lines indicate the 95% confidence interval for 1,000 samples.
F. 3-unicycle coefficient is the probability ratio of completing two consecutive unidirectional edges with a 3-cycle rather than a feedforward motif.
G. 3-cycle coefficient is the probability ratio of completing two consecutive edges with one recurrent edge rather than a feedforward edge.
H-I. Comparisons of 3-unicycle coefficients and 3-cycle coefficients, respectively. Green bars indicate the measurement of observed networks, yellow bars indicate the expected values from the configuration model, and gray error bars indicate standard deviations (N=1,000). modO|ss stands for the strong subgraph of modO. The last two columns include results for the C. elegans interneuron subnetwork (79 neurons) and the entire wiring diagram (270 neurons + 115 end-organ cells).
See also Figure S4.
