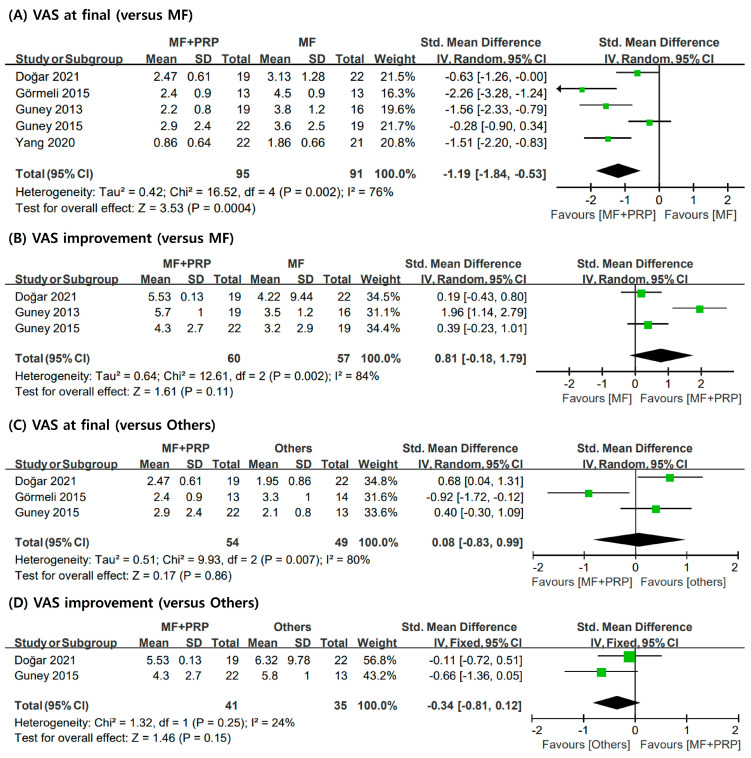
Figure 3.
Meta-analysis results for VAS scores: (A) final VAS scores compared to MF only; (B) improvement of VAS scores compared to MF only; (C) final VAS scores compared to others group; (D) improvement of VAS scores compared to others group. VAS: Visual Analog Scale; MF: microfracture; PRP: plasma-rich platelet; SD: standard deviation.

