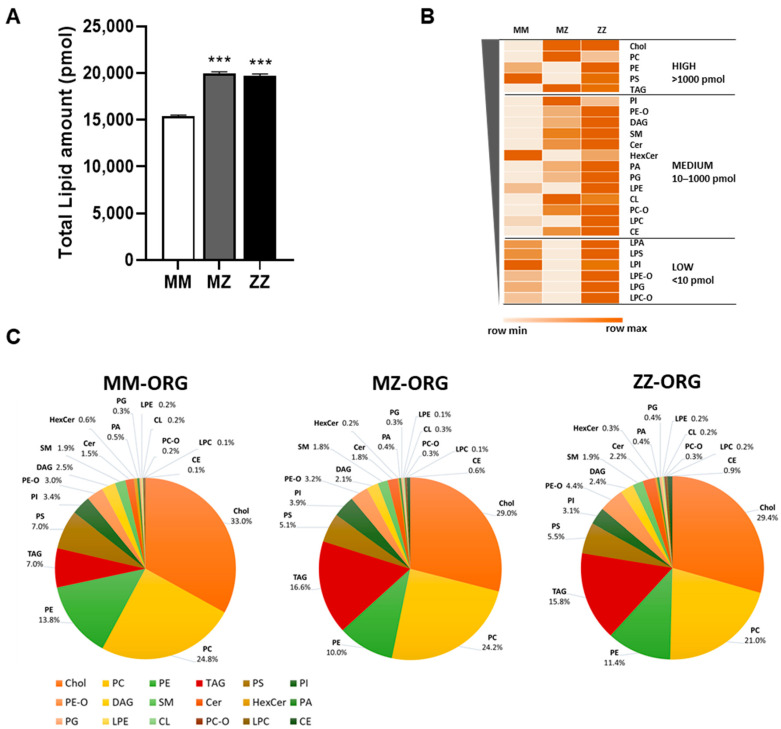
Figure 3.
Lipid content in AATD-derived organoids. (A) Total amount of lipids (pmol) in MZ and ZZ organoids compared to MM ones; data represent the mean of three different replicates analyzed (*** p ≤ 0.005). (B) Heat-map showing the mean amount of each lipid in the MM, MZ, and ZZ organoids. Lipid species are ordered from the most abundant in MM organoids at the top to the lowest at the bottom. Groups separating the most highly abundant lipids (>1000 pmol), intermediate level (10–1000 pmol), and low abundant (>10 pmol) are represented. (C) Diagrams showing the percentages, relative to the total amount, of each lipidic species in the MM-, MZ-, and ZZ-ORG. The lipid distribution in MZ- and ZZ-ORG show more similar profiles compared to MM-ORG.

