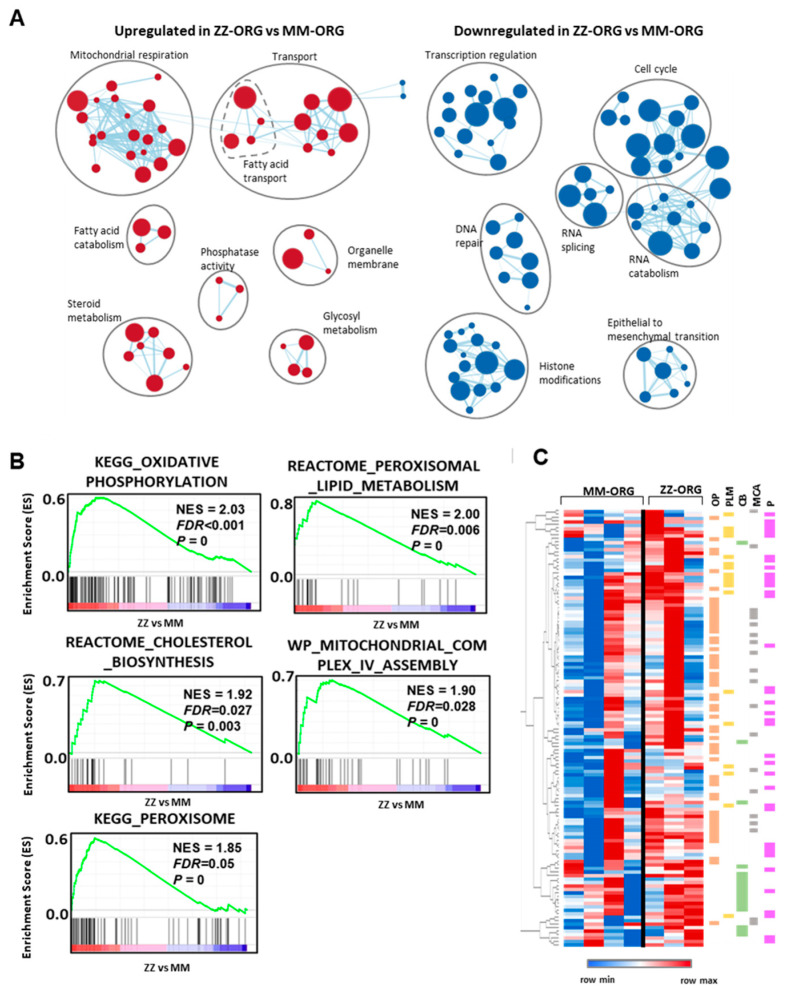
Figure 4.
GSEA analysis of ZZ-ORG vs. MM-ORG differential gene expression. (A) Clusters of GO gene sets differentially enriched in ZZ-ORG vs. MM-ORG at p-value < 0.01 according to preranked GSEA analysis. Node size is proportional to the number of genes identified in each gene set. The light blue edges indicate gene overlap between gene sets. (B) Graphs of positive enrichment scores (ESs) found in preranked GSEA analysis in ZZ-ORG compared to MM-ORG. (C) Unsupervised hierarchical cluster heatmap of mRNA levels of genes belonging to the leading edge of pathways depicted in B. Lower expression of genes is represented in blue and higher expression in red. Genes belonging to the pathways of oxidative phosphorylation (OP) are in orange, peroxisomal lipid metabolism (PLM) in green, cholesterol biosynthesis (CB) in yellow, mitochondrial complex IV assembly (MCA) in grey, and peroxisome (P) in pink are indicated.

