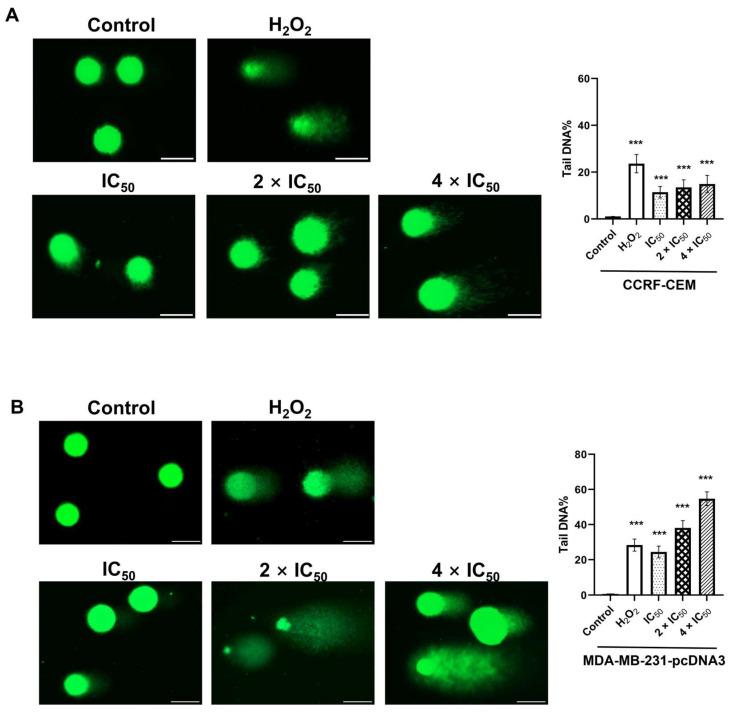
Figure 7.
Analysis of DNA damage by single cell gel electrophoreses (alkaline comet assay) induced by ZINC15675948. Representative comet images captured in (A) CCRF-CEM and (B) MDA-MB-231-pcDNA3 cells treated with different concentrations for 24 h. H2O2 and DMSO served as positive or negative controls. Scale bar, 50 µm. The graph showed tail DNA percentage presented as mean values ± SEM from 50 comets. Statistical significance (*** p ≤ 0.001) was compared to DMSO.

