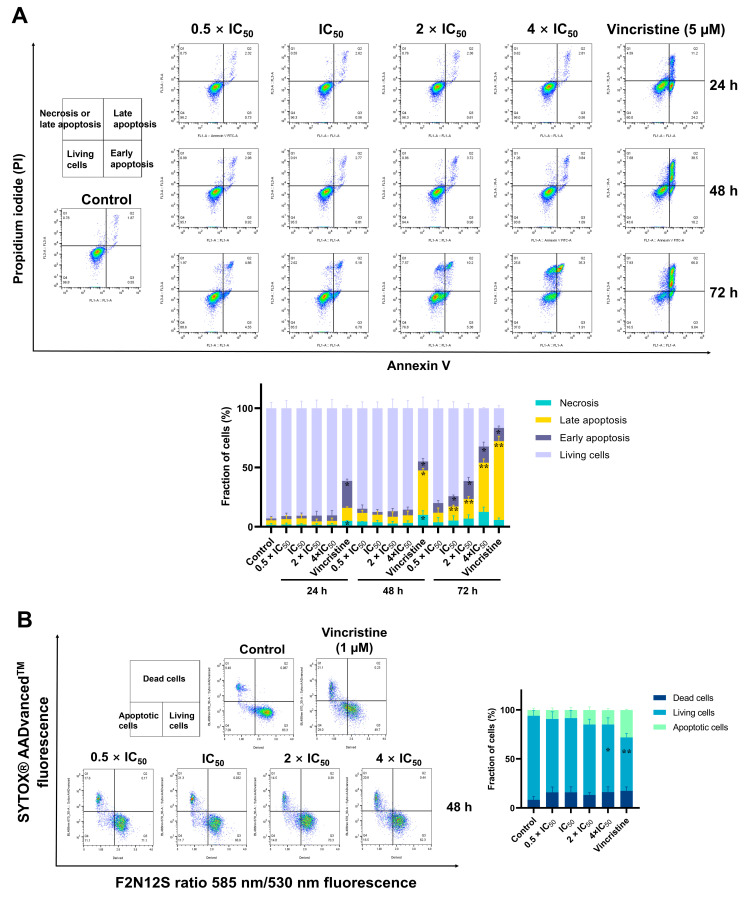
Figure 9.
Detection of apoptosis induced by ZINC15675948 by flow cytometry. (A) Histograms of CCRF-CEM cells treated with different concentrations of ZINC15675948 for 24, 48, and 72 h. Vincristine (5 µM) and DMSO served as positive and negative controls. Apoptosis was detected using Annexin V and PI staining. (B) Histograms of MDA-MB-231-pcDNA3 cells treated with different concentrations of ZINC15675948 for 48 h. Vincristine (1 µM) and DMSO served as positive and negative controls. Apoptosis was determined using F2N12S and SYTOX® AADvancedTM dye. The experiments were performed three times independently. Statistical significance was analyzed using Student’s t-test, * p < 0.05, ** p < 0.01 vs. DMSO.

