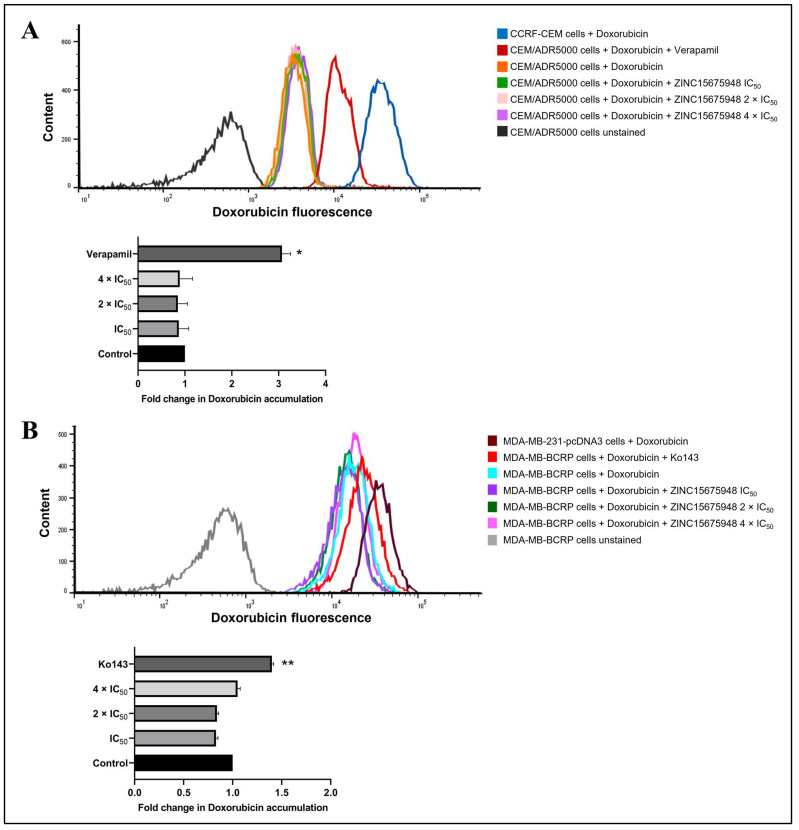
Figure 11.
Doxorubicin uptake assay with ZINC15675948. (A) Flow cytometric analysis of doxorubicin fluorescence intensity in unstained CEM/ADR5000 cells (autofluorescence, black), CEM/ADR5000 cells treated with doxorubicin (orange), doxorubicin in combination with ZINC15675948 IC50 (green), 2 × IC50 (pink), and 4 × IC50 (violet). CEM/ADR5000 cells treated with doxorubicin in combination with verapamil, a known P-gp inhibitor were used as a positive control. CCRF-CEM cells treated with doxorubicin (blue) were applied as a positive control for doxorubicin uptake. (B) Flow cytometric analysis of doxorubicin fluorescence intensity in unstained MDA-MB-BCRP cells (autofluorescence, red-brown), MDA-MB-BCRP cells treated with doxorubicin (cyan), doxorubicin in combination with ZINC15675948 IC50 (purple), 2 × IC50 (green), and 4 × IC50 (pink). MDA-MB-BCRP cells treated with doxorubicin in combination with Ko143 (red), a known BCRP inhibitor was used as a positive control. MDA-MB-231-pcDNA3 cells treated with doxorubicin (grey) were applied as a positive control for doxorubicin uptake. Quantification of fluorescence intensity is shown in the below bar diagram. Three replicates of the experiments were performed, and the results were shown as mean ± SD (* p ≤ 0.05, ** p ≤ 0.01, compared with doxorubicin-treated cells alone).

