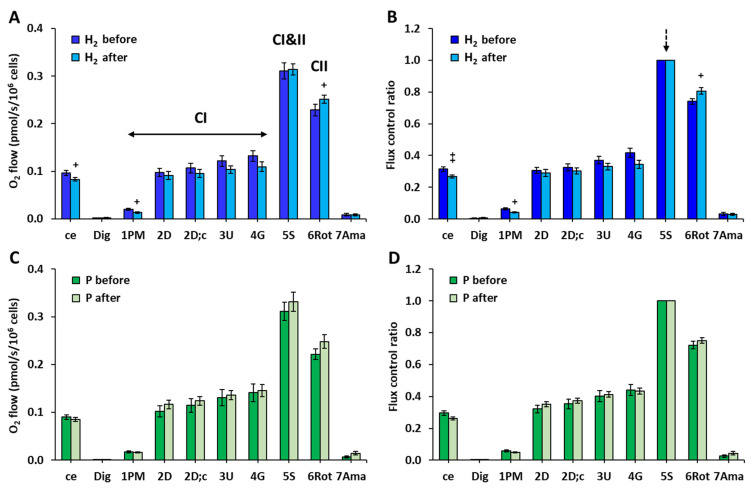
Figure 2.
Bioenergetics in platelet mitochondria in the groups of NAFLD patients at the beginning and end of the study. (A,C) Parameters of mitochondrial respiration and ATP production in platelets of H2 and P groups of patients with NAFLD expressed as O2 flow (pmol/s/106 cells). (B,D) Parameters of mitochondrial respiration and ATP production in platelets of H2 and P groups of patients with NAFLD expressed as flux control ratio. The bars show mean ± standard error of mean (sem). The evaluated respiratory capacities are marked according to the titration steps in the substrate–uncoupler–inhibitor titration (SUIT) reference protocol 1 [27] and correspond to following respiratory states: ce—routine respiration of intact cells; Dig—residual oxygen consumption (ROX) after permeabilization with digitonin; 1PM—LEAK respiration with CI-linked substrates pyruvate and malate; 2D—CI-linked OXPHOS capacity (associated with ATP production); 2D; c—CI-linked OXPHOS capacity after addition of cytochrome c as a test for integrity of outer mitochondrial membrane; 3U—CI-linked electron transfer (ET) capacity with pyruvate and malate; 4G—CI-linked ET capacity with pyruvate, malate, and glutamate; 5S—CI&II-linked ET capacity; 6Rot—CII-linked ET capacity; 7Ama—ROX after inhibition of mitochondrial CIII. H2 before, H2 after—the group of patients with NAFLD before and after 8-week adjuvant therapy with HRW; P before, P after—the group of patients with NAFLD before and after 8 weeks of taking placebo. CI—respiration related to mitochondrial CI activity; CI&II—respiration related to mitochondrial CI and CII activity; CII—respiration related to mitochondrial CII activity. + p < 0.05, ++ p < 0.01 vs. the same group at the beginning of the study.

