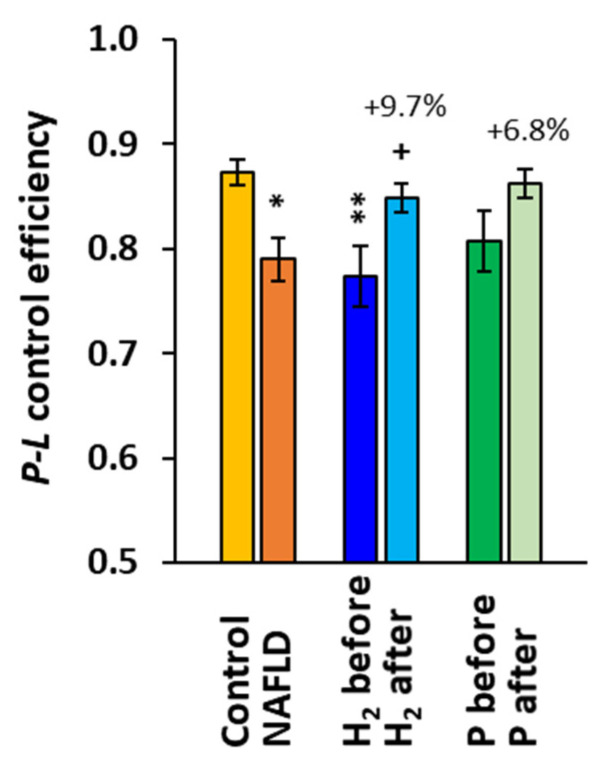
Figure 3.
P-L control efficiency in platelet mitochondria in the control group, NAFLD patients, and groups H2 and P of NAFLD patients at the beginning and the end of the study. P-L control efficiency was calculated from parameters of mitochondrial respiration as (2D-1PM)/2D (for parameters of mitochondrial respiration refer to Figure 1). * p < 0.05, ** p < 0.01 vs. the control group; + p < 0.05 vs. the same group at the beginning of the study. The values (%) above the bars show the relative change vs. baseline values in each group.

