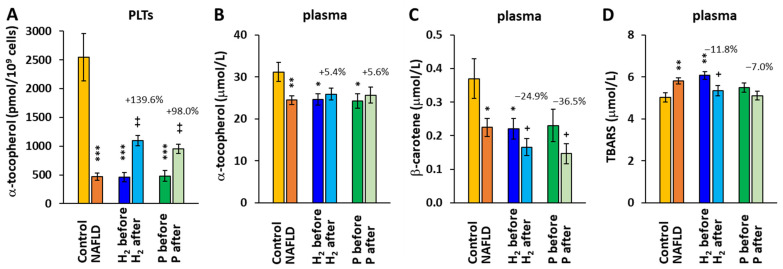
Figure 6.
The concentration α-tocopherol in platelets (A) and plasma (B); the concentration of β-ca-rotene in plasma (C); and the concentration of thiobarbituric acid reactive substances (TBARS) in plasma (D). Control—the control group; H2 before, H2 after—the group of patients with NAFLD before and after 8-week adjuvant therapy with HRW; P before, P after—the group of patients with NAFLD before and after 8 weeks of taking placebo. * p < 0.05, ** p < 0.01, *** p < 0.001 vs. the control group; + p < 0.05, ++ p < 0.01 vs. the same group at the beginning of the study. The values (%) above the bars show the relative change vs. baseline values in each group.

