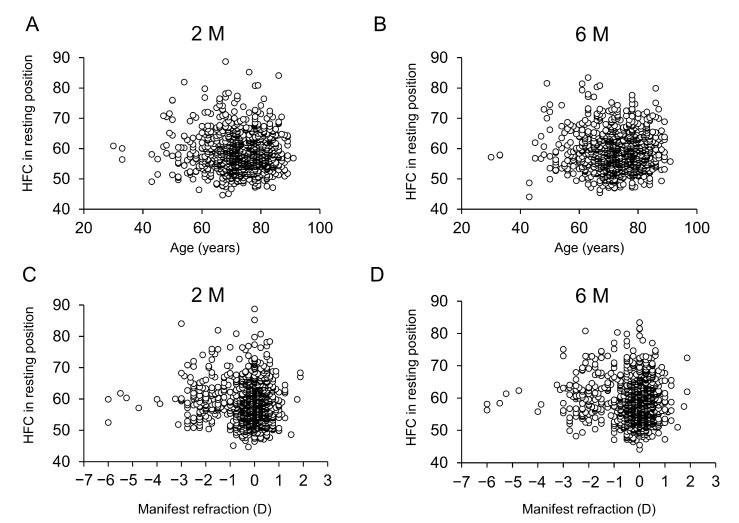
Figure 2.
Relationship of high-frequency component values with patient age and manifest refraction after cataract surgery. Relationship between HFC values and patient age at 2 M (A) and 6 M (B). HFC values based on the patient age are plotted (○) (A,B). HFC values based on the manifest refraction are plotted (○) (C,D). There was no significant difference in HFC values according to age at either time point (A: r = −0.022, p = 0.462, B: r = 0.003, p = 0.912). Relationship between HFC values and manifest refraction at 2M (C) and 6 M (D). There was no significant difference in HFC values according to manifest refraction at either time point (C: r = −0.002, p = 0.940, D: r = −0.017, p = 0.569).

