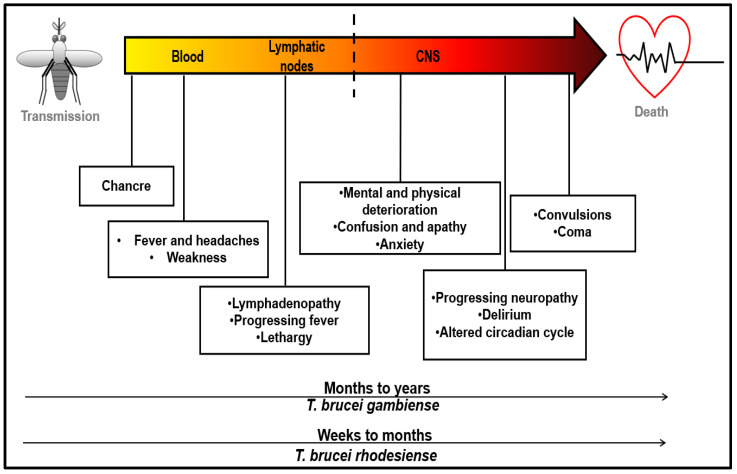
Figure 3.
Progression of human African trypanosomiasis. The diagram highlights some of the defining symptoms of HAT as they relate to the progression of the T. brucei infection. The dashed line demarcates the point at which the parasitic infection infiltrates the CNS. The arrows at the bottom of the infographic indicate the different rates at which R-HAT and G-HAT progress. Adapted from [69].

